Accuracy vs. precision vs. recall in machine learning
Learn about Accuracy, Precision, and Recall in machine learning. Explore the Confusion Matrix, F1 Score, and how to use these vital evaluation metrics.

Machine learning (ML) is a branch of artificial intelligence (AI) that focuses on creating systems that learn from data. It plays a central role in many other areas of AI, including computer vision, where machines interpret images, and natural language processing, where they understand and generate human language.
Often, such AI models use deep learning techniques to make predictions from data. While such systems can be highly effective, they don’t always produce correct predictions. Some outputs may be accurate, while others miss the target.
Knowing how these errors occur is a key part of evaluating how well a model performs. To measure performance, we can use model evaluation metrics.
Common evaluation metrics include accuracy (overall correctness), precision (reliability of positive predictions), and recall (how well the model identifies actual positives). They may seem similar at first, but each one focuses on a different part of a model's behavior.
In this article, we’ll take a closer look at each of these AI model performance metrics. We’ll also explore how they relate to each other and how to choose the right one for your use case. Let’s get started!
Link to this sectionModel evaluation metrics matter in machine learning#
A machine learning model might seem like it's performing well at first. But without the right evaluation metrics, it's difficult to understand how accurate its results are. These metrics give structure to model assessment and help answer a key question: Are the model’s predictions useful and reliable for a given task?
Metrics such as accuracy, precision, and recall give AI developers a clear way to measure how well a model is working. For example, when comparing different models, these metrics make it possible to see which one performs best for a specific task. They help evaluate performance and guide the choice of the model that best fits the goals of an AI project.
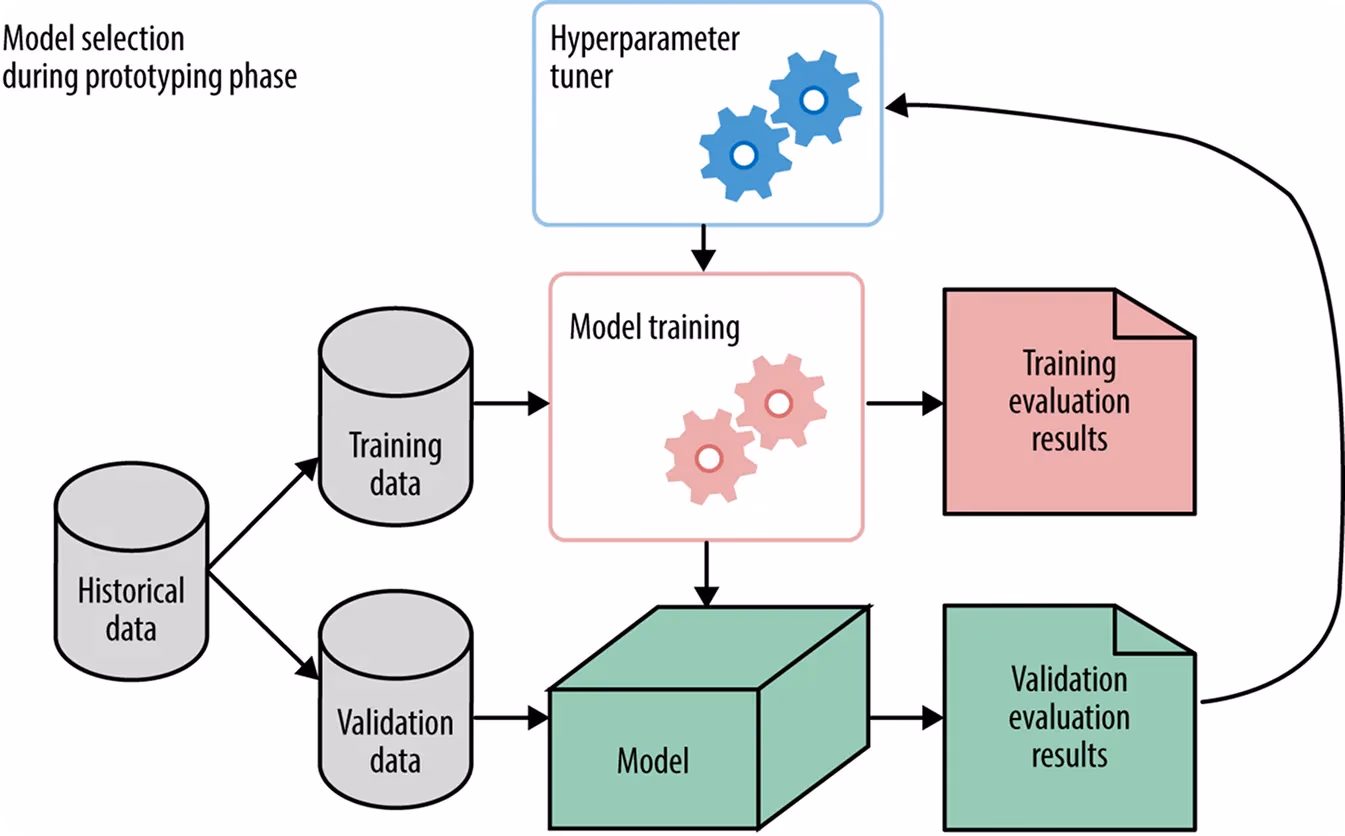
Fig 1. Model training and evaluation workflow (Source)
These metrics also make performance comparisons more objective. Instead of relying on guesswork or incomplete observations, they provide measurable insights into how a model behaves in different situations. By doing so, they highlight which aspects of performance matter most in each context.
For instance, the choice of metric often depends on the application. In AI healthcare applications, recall is important because the goal is to identify as many positive cases as possible, even if some negatives are mistakenly flagged. In contrast, an email spam filter may prioritize precision to avoid incorrectly marking legitimate emails as spam.
Link to this sectionThe confusion matrix: The foundation of classification metrics#
The confusion matrix is a two-by-two table that is fundamental for evaluating AI models. It organizes predictions into four categories by comparing the actual outcomes with the predicted outcomes (the answers the model gives).
This comparison provides a detailed view of the model’s performance. It forms the basis for key evaluation metrics like precision and recall, which are calculated directly from the values in the matrix.
The rows of the table represent the actual classes, and the columns represent the predicted classes. Each cell shows the count of outcomes in that category. Simply put, it showcases how many predictions were correct and the types of errors the model made.
The confusion matrix is especially useful when the data is imbalanced, meaning some categories have many more examples than others. It’s also helpful when different types of mistakes carry different costs.
For example, in fraud detection, catching fraudulent activity is critical, but incorrectly flagging real transactions can also cause problems. The matrix makes it clear how often each type of error happens.
Link to this sectionElements of the confusion matrix#
Here’s an overview of the different elements in a confusion matrix:
- True positive (TP): When the model correctly predicts a positive instance, it is recorded as a true positive. For example, a computer vision model correctly classifies a vehicle in an image.
- True negative (TN): A true negative occurs when the model correctly identifies a negative instance. For instance, an email classifier marks a regular message as not spam.
- False positive (FP): The model generates a false positive when it incorrectly predicts a positive outcome for an instance that is actually negative. Also known as a Type I Error, this can happen when a fraud detection system flags a valid transaction as fraudulent.
- False negative (FN): A false negative is recorded when the model fails to detect a positive case and incorrectly predicts it as negative. Also referred to as a Type II Error, this may occur when a diagnostic tool misses a disease in a patient who is actually ill.
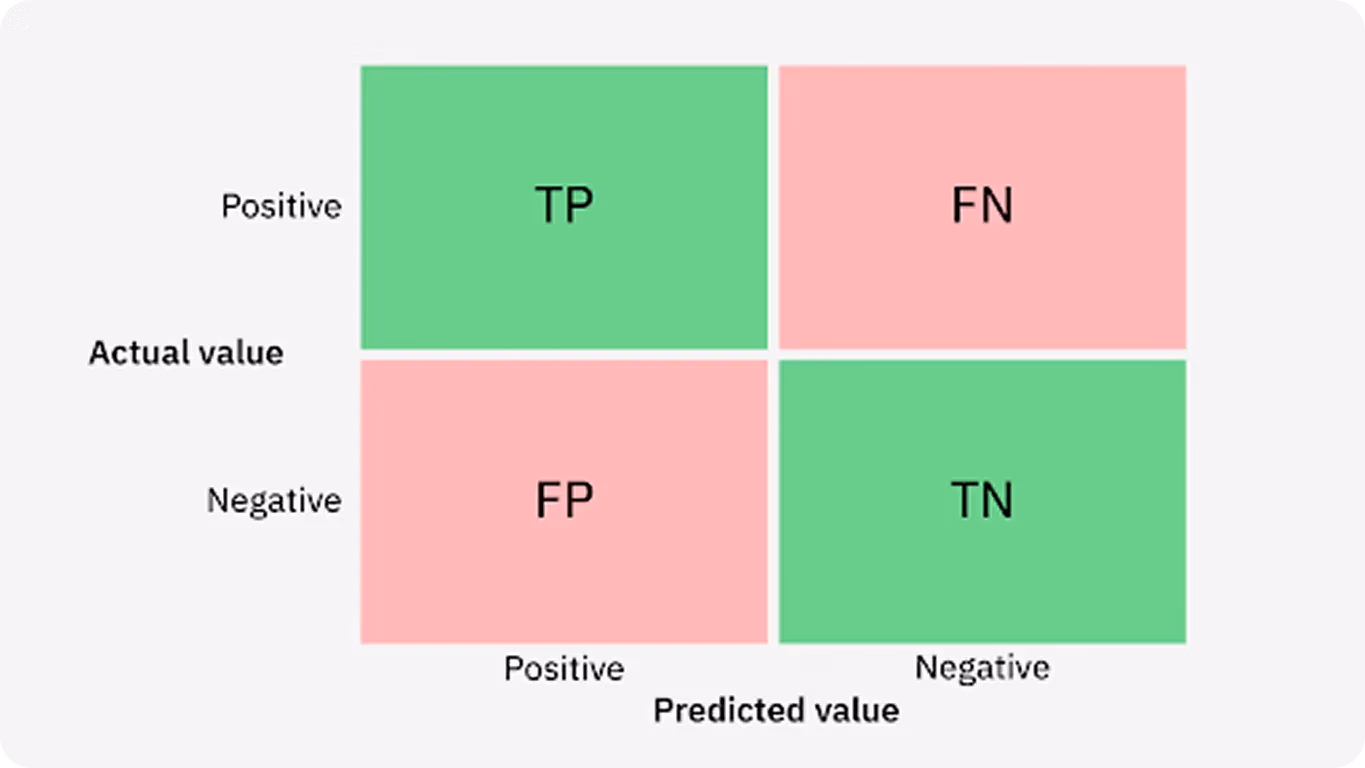
Fig 2. The elements of a confusion matrix (Source)
Link to this sectionVisual representation and interpretation of the confusion matrix#
A confusion matrix is displayed in a grid format. The vertical axis shows actual classes, and the horizontal axis shows predicted classes. Correct predictions appear along the diagonal, representing true positives and true negatives.
Errors fall outside the diagonal, covering false positives and false negatives. This structure makes it easy to spot strengths and weaknesses.
Link to this sectionWhat is accuracy in machine learning?#
Accuracy is one of the most widely used metrics for evaluating how well a machine learning model performs. It measures how often the predictions are correct across all classes. In other words, it answers a simple question: Out of all the predictions the AI model made, how many were right?
The formula for accuracy is the number of correct predictions (which includes both true positives and true negatives) divided by the total number of predictions. Accuracy is straightforward to compute and easy to understand, which makes it a common starting point in model evaluation.
Generally, accuracy is reliable when handling balanced datasets. However, accuracy can often be misleading in imbalanced datasets where one class dominates others. A model that always predicts the majority class may still achieve a high accuracy score while failing to detect other minority classes.
For example, in an image dataset where only a few images contain pedestrians, a model that predicts “no pedestrian” for every image may still achieve high accuracy but completely fail to detect the actual pedestrians.
This is because accuracy by itself doesn’t show what kinds of mistakes a model makes or how often they happen. That’s why it’s important to also look at metrics like precision and recall to fully understand how well an AI model works.
Link to this sectionDeep dive into precision: Minimizing false alarms#
Precision is a key evaluation metric that measures the accuracy of a model’s positive predictions. It answers the question: Of all the instances predicted as positive, how many were correct?
The precision formula is the number of true positives divided by the sum of true positives and false positives. It is particularly important when a positive prediction would be costly if it turned out to be wrong.
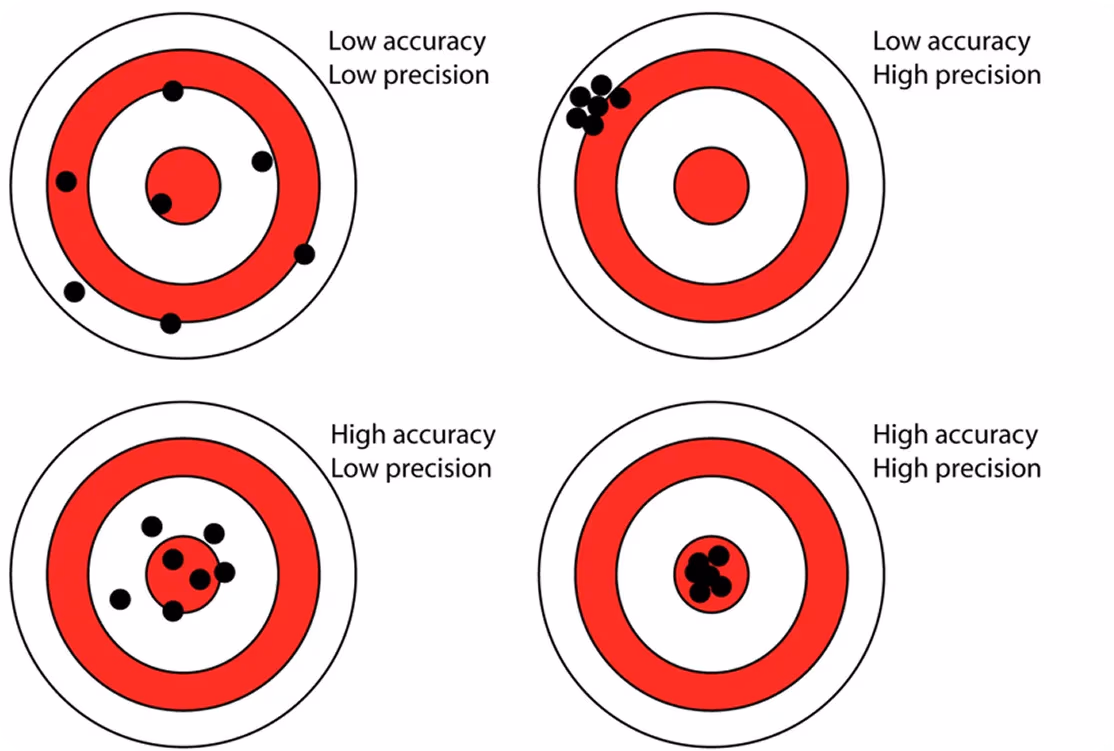
Fig 3. Comparing accuracy and precision. (Source)
For example, in fraud detection, a model with low precision may flag many valid transactions as fraudulent, creating unnecessary issues for both users and support teams. A model with high precision reduces this risk by making sure that flagged transactions are more likely to be actual fraud.
While high precision is good, models that focus too much on it can become very selective, missing actual positive cases. That’s why the precision metric is often checked along with recall to keep performance balanced.
Link to this sectionWhat is recall?#
Recall is a metric that is used to measure how well a model identifies actual positive cases. It is known as sensitivity or true positive rate, and it answers the question: Of all the actual positive instances, how many did the model detect correctly?
The formula for recall is the number of true positives divided by the sum of true positives and false negatives. A high recall score shows that the model is capturing most of the real positive cases in the data.
Recall is essential in industries like healthcare, where failing to detect a condition can delay treatment and put patients at risk. Even if some negative cases are incorrectly flagged, identifying all true cases remains the top priority.
However, models that focus only on recall can flag too many false positives, which lowers precision and hurts the overall efficiency of the model. Balancing recall and precision is crucial for reliable AI model performance.
Link to this sectionThe balancing act: Precision and recall trade-off#
Precision and recall often move in opposite directions. When one improves, the other can decline. This trade-off is a common challenge in machine learning tasks.
A high-precision model predicts something as positive only when it is confident. This reduces false alarms but can miss real positives, which lowers recall. A model that tries to catch every positive raises recall but risks more false alarms, which lowers precision.
This trade-off becomes clearer when you adjust the model’s decision threshold. The threshold is the cutoff a system uses to turn a score or probability into an action or label. Lowering the threshold makes the system act positively more often, which can increase recall but may reduce precision. Raising the threshold has the opposite effect: the model predicts fewer positives, precision improves, but recall usually drops.
Let’s say you’re working on spam detection. The model has to balance the risk of letting spam into the inbox with the risk of blocking real emails. A strict filter may still miss some spam, while a more lenient one may accidentally block legitimate messages. The right balance depends on the use case and the cost of each type of error.
Link to this sectionThe significance of the precision–recall curve#
The precision-recall curve or PR curve shows how precision and recall change as the model’s decision threshold changes. Each point represents a different trade-off between the two. The PR curve is especially useful for imbalanced datasets, where one class is much less frequent.
It also provides more meaningful insight than the Receiver Operating Characteristic (ROC) curve, which also shows how well a model separates positives from negatives at different decision thresholds. A model with both high precision and high recall will have a precision–recall curve that stays near the upper-right corner, which is generally ideal.
Link to this sectionIntroducing the F1-score: A combined metric for balance#
The F1-score provides a single value that captures the balance between precision and recall. The F1-score is calculated as two times the product of precision and recall, divided by the sum of precision and recall. It’s useful when both false positives and false negatives matter, and it's helpful when working with imbalanced datasets or when a balanced view of model performance is needed.
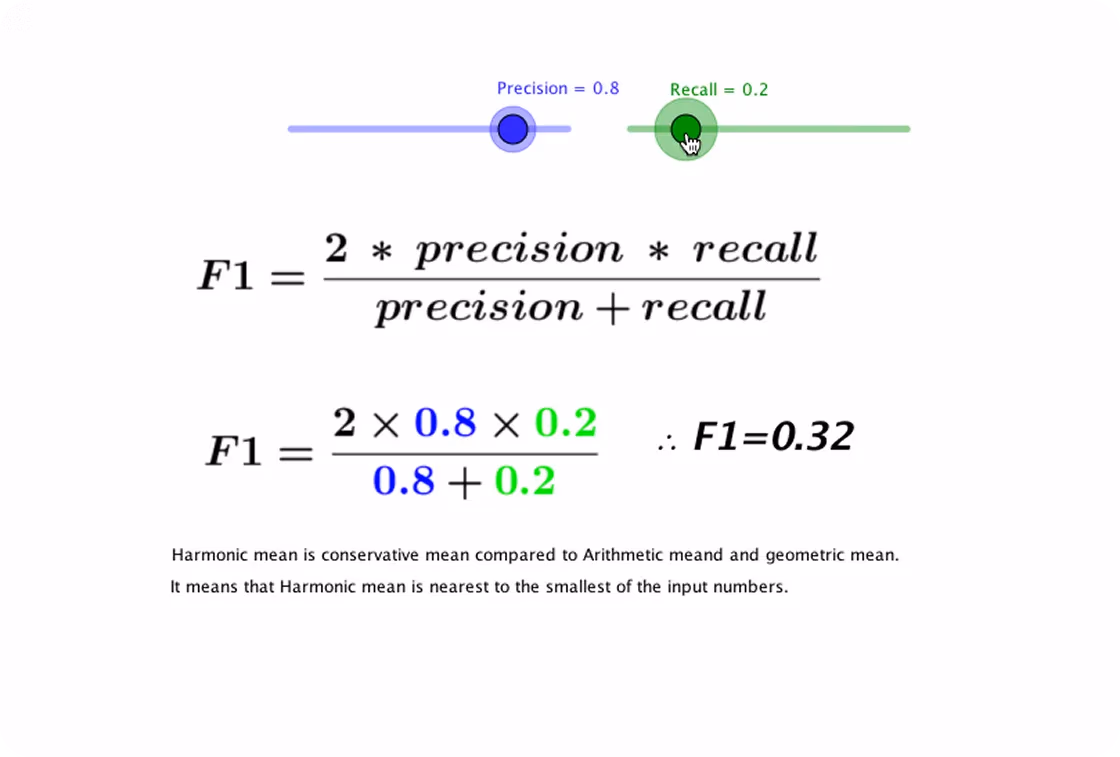
Fig 4. Calculating F1-score using precision and recall (Source)
Link to this sectionBeyond accuracy, precision, and recall#
While accuracy, precision, and recall are essential, other metrics offer additional insights based on the model type and dataset characteristics.
Here are some commonly used metrics that help evaluate different aspects of performance:
- Specificity: It measures how well the model identifies actual negatives. It is useful when avoiding false positives is important.
- AUC: AUC, or Area Under the Curve, gives a single score that reflects how well the model can distinguish between classes.
- Log loss: Log loss is used to measure how confident a model is when making predictions and gives more penalty to wrong predictions made with high confidence. Here, confidence refers to how sure the model is about its prediction.
- Multi-label evaluation: In multi-label tasks, metrics are averaged across labels to reflect overall model performance.
Link to this sectionApplying accuracy, precision, and recall in computer vision#
Now that we have a clearer understanding of accuracy, precision, and recall, let’s walk through how these metrics are applied in computer vision.
Computer vision models like Ultralytics YOLO11 support tasks such as object detection, where the model identifies what objects are present in an image and locates them using bounding boxes. Each prediction includes both the object label and its position, which makes evaluation more complex than simply checking whether a label is correct.

Fig 5. An example of using Ultralytics YOLO11 for object detection. (Source)
Consider a retail application where cameras are used to automatically track products on shelves. An object detection model might identify items like cereal boxes, soda cans, or bottles of water and mark their positions.
In this case, precision tells us how many of the detected items are actually correct. High precision means the system avoids false positives, such as labeling a shadow or background object as a product. Recall shows how many of the real products on the shelf the model managed to detect. High recall means fewer items are missed, which is critical for accurate inventory counts.
Accuracy can still provide a general measure of correctness, but in this kind of setting, missing even a few products or detecting items that aren’t there can have a big impact on stock management. That’s why developers look at precision, recall, and accuracy together to ensure the system is both reliable and practical for real-world use.
Link to this sectionAccuracy, precision, and recall: Key takeaways#
Accuracy, precision, and recall each showcase different aspects of a machine learning model’s performance. Relying on just one metric can be misleading.
Tools and metrics like the confusion matrix, precision–recall curves, and the F1-score help reveal trade-offs and guide decisions on making improvements to the ML model. By choosing the right combination of metrics for a specific AI solution, you can ensure models are accurate, reliable, and effective in real-world applications.
Explore our growing community! Check out our GitHub repository to learn more about AI. Ready to start your computer vision projects? Take a look at our licensing options. Discover AI in agriculture and vision AI in robotics by visiting our solutions pages!


