3D Object Detection
3D object detection places a 3D box around each object, giving its position, size and heading in meters. Sensors, methods, benchmarks and a box example.
3D object detection finds objects in a scene and places a 3D bounding box, or cuboid, around each one, giving its position, size, and orientation in real-world units. Standard 2D object detection reports a bounding box in image pixels. A 3D detector reports how far away a car is in meters, how long and wide it is, and which way it faces, which is the information self-driving cars, delivery robots, and warehouse arms need to plan motion and avoid collisions.
How a 3D Box Is Described#
Most 3D detectors output seven numbers per object, plus a class and a confidence score: the box center (x, y, z), its length, width, and height, and a heading, or yaw angle, around the vertical axis. Roll and pitch are assumed to be zero because cars, people, and most indoor objects stand upright, and driving benchmarks such as nuScenes also ask for each object's velocity. Converting the seven numbers into eight corner points is the first step for drawing a box on an image or computing its overlap with another box.
import numpy as np

# One 3D box: center (m), size (m), and heading around the vertical z-axis (rad)
center = np.array([12.0, -3.0, 0.9])
length, width, height = 4.5, 1.9, 1.6
yaw = np.pi / 6

# Eight corners of the box before rotation, relative to its center
signs = np.array([[sx, sy, sz] for sx in (1, -1) for sy in (1, -1) for sz in (1, -1)])
corners = signs * [length / 2, width / 2, height / 2]

# Rotate by the heading, then move the box to its center
c, s = np.cos(yaw), np.sin(yaw)
rotation = np.array([[c, -s, 0], [s, c, 0], [0, 0, 1]])
corners = corners @ rotation.T + center
print(corners.round(2))
The eight printed rows are the corners of a car-sized box centered 12 meters along the x-axis and turned 30 degrees, four at z = 1.7 m for the roof and four at z = 0.1 m for the floor.
Sensors and Methods#
3D detection needs depth, and systems get it from three kinds of input. Lidar scanners measure distance directly with laser pulses and return a point cloud of the scene. Lidar detectors divide space into 3D voxels, group points into vertical columns, as PointPillars does, and process them as a bird's-eye-view image with fast 2D convolutions, or work on the raw points directly.
Camera-based methods infer depth from images. A single camera leaves depth ambiguous, because a small nearby object and a large distant one can look the same, so monocular detectors learn depth from object size and scene context. Multi-camera systems such as BEVFormer lift features from several surrounding views into one shared bird's-eye-view grid. Camera pipelines can also pair 2D boxes from YOLO26 with a YOLO26 depth model, which predicts a per-pixel depth map in meters from one RGB image, to estimate how far away each detected object is.
Sensor fusion combines lidar's precise geometry with the color and texture of camera images. BEVFusion merges both sensors' features in a shared bird's-eye-view space.
3D Detection vs. Related Tasks#
- Depth estimation: predicts a distance for every pixel, without separating the scene into objects or classes.
- Oriented bounding boxes: rotated 2D boxes in the image plane, often used on aerial images, where they resemble the top-down footprint of a 3D box.
- 3D reconstruction: recovers the full geometry of a scene, such as a mesh or point cloud, without labeling individual objects.
Applications and Challenges#
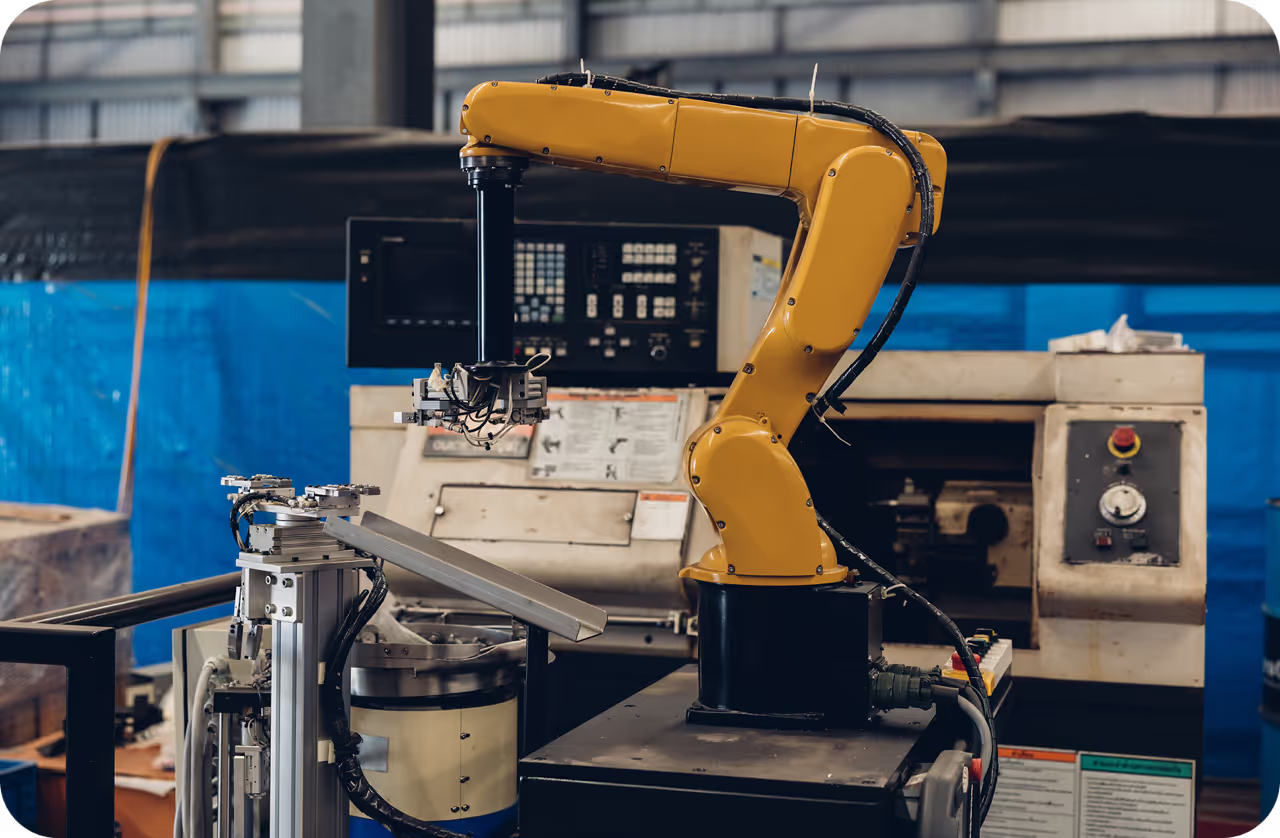
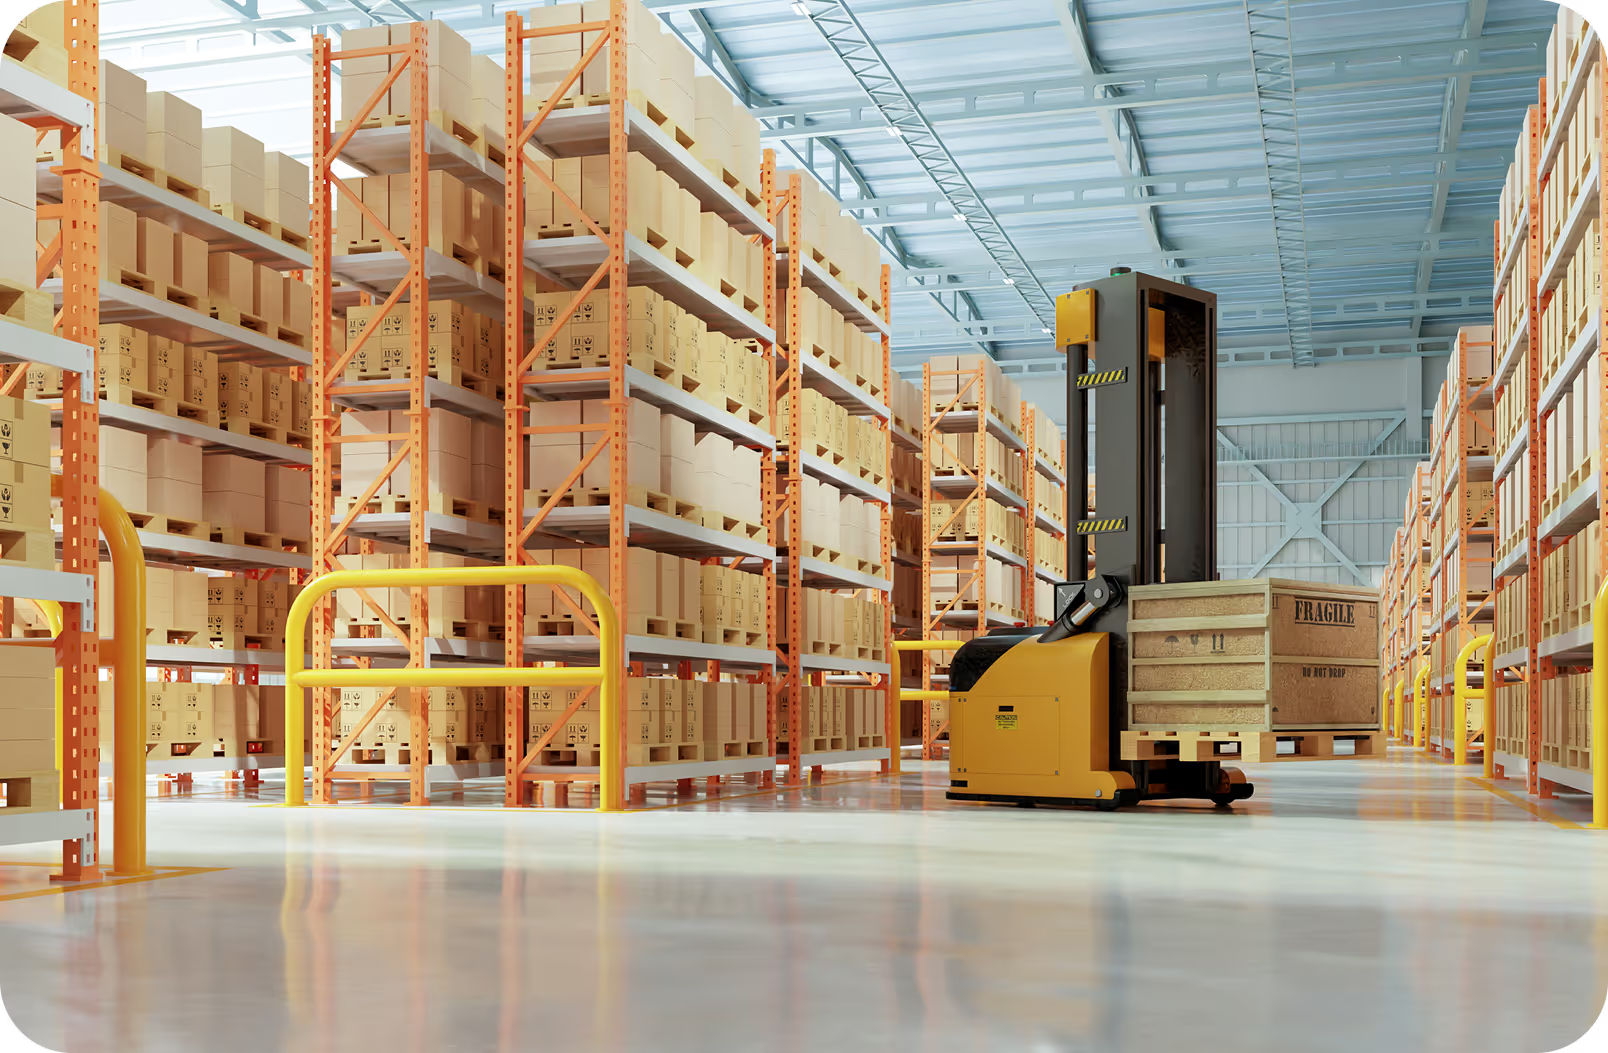
Autonomous vehicles use 3D detection to locate cars, pedestrians, and cyclists around them and to predict their paths, and warehouse and logistics robots use it to find the position and orientation of boxes before grasping them. The hard cases are distant and small objects, which receive few lidar points; partly occluded objects; monocular depth errors, which grow with distance; and labeling cost, since every training cuboid must be fitted in 3D by an annotator.
Evaluating 3D Detectors#
Evaluation extends intersection over union (IoU) and mean average precision (mAP) into three dimensions. KITTI's 3D benchmark requires a 3D box IoU of 0.7 for cars and 0.5 for pedestrians and cyclists, and since 2019 it averages precision at 40 recall positions instead of 11. The nuScenes benchmark matches predictions to labels by the distance between their centers on the ground plane and averages AP over thresholds of 0.5, 1, 2, and 4 meters. Its nuScenes detection score (NDS) combines that mAP, weighted 5, with five scores derived from translation, scale, orientation, velocity, and attribute errors, each weighted 1.