Data Mining
Veri madenciliği tekniklerini ve uygulamalarını keşfet. Ultralytics YOLO26'yı kullanarak içgörüleri nasıl çıkaracağını, kalıpları nasıl tanımlayacağını ve yapay zeka iş akışlarını nasıl optimize edeceğini öğren.
Veri madenciliği, anlamlı kalıpları ve eğilimleri ortaya çıkarmak için büyük bilgi bloklarını keşfetme ve analiz etme sürecidir. İstatistik, makine öğrenimi (ML) ve veritabanı sistemlerinin kesişim noktasında yer alır ve "Veritabanlarında Bilgi Keşfi" (KDD) sürecinde kritik bir adım görevi görür. Veri madenciliği, devasa miktardaki ham veriyi eleyerek yapılandırılmamış gürültüyü, işletmelerin ve araştırmacıların bilinçli kararlar almak için kullandığı yapılandırılmış, uygulanabilir içgörülere dönüştürür.
Modern yapay zeka (AI) bağlamında veri madenciliği, genellikle tahmine dayalı modellemenin öncüsüdür. Bir algoritma geleceği tahmin edebilmeden önce geçmişi anlamalıdır. Örneğin, bilgisayarlı görü (CV) alanında, madencilik teknikleri, belirli bir nesne sınıfını tanımlayan kenarlar, dokular veya şekiller gibi ortak özellikleri belirlemek için binlerce görüntüyü analiz ederek sağlam veri kümeleri eğitmenin temelini oluşturabilir.
Link to this sectionVeri Madenciliğinde Temel Teknikler#
Veri madenciliği, verilerdeki gizli ilişkileri ortaya çıkarmak için çeşitli gelişmiş metodolojilere dayanır. Bu teknikler, analistlerin basit veri özetlemenin ötesine geçerek derinlemesine keşif yapmalarına olanak tanır.
- Sınıflandırma: Bu, veri öğelerini önceden tanımlanmış gruplara veya sınıflara ayırmayı içerir. Vizyon yapay zekasında bu, bir modeli geçmiş etiketli örneklere dayanarak "araba" ve "yaya" arasında ayrım yapacak şekilde eğitme sürecini yansıtır.
- Kümeleme Analizi: Sınıflandırmadan farklı olarak kümeleme, veri noktalarını önceden tanımlanmış etiketler olmaksızın benzerliklerine göre gruplandırır. Bu, bir algoritmanın müşteri satın alma davranışlarını veya benzer görüntü dokularını otomatik olarak gruplandırabileceği denetimsiz öğrenme için esastır. Kümeleme yöntemleri hakkında daha fazla bilgiyi Scikit-learn dokümantasyonunda bulabilirsin.
- Anomali Tespiti: Bu teknik, normdan önemli ölçüde sapan veri noktalarını tanımlar. Finansta dolandırıcılık tespiti veya bir üretim hattında üretim hatalarının bulunması için çok önemlidir.
- Birliktelik Kuralı Öğrenimi: Bu yöntem, bir veritabanındaki değişkenler arasındaki ilişkileri keşfeder. Klasik bir örnek, perakendecilerin ekmek alan müşterilerin muhtemelen tereyağı da alacağını belirlemek için kullandığı pazar sepeti analizi yöntemidir.
- Regresyon Analizi: Diğer değişkenlere dayalı olarak sürekli bir sayısal değer tahmin etmek için kullanılan regresyon, satış eğilimlerini tahmin etmek veya derinlik tahmini görevlerinde bir nesnenin mesafesini hesaplamak için hayati öneme sahiptir.
Link to this sectionGerçek Dünya Uygulamaları#
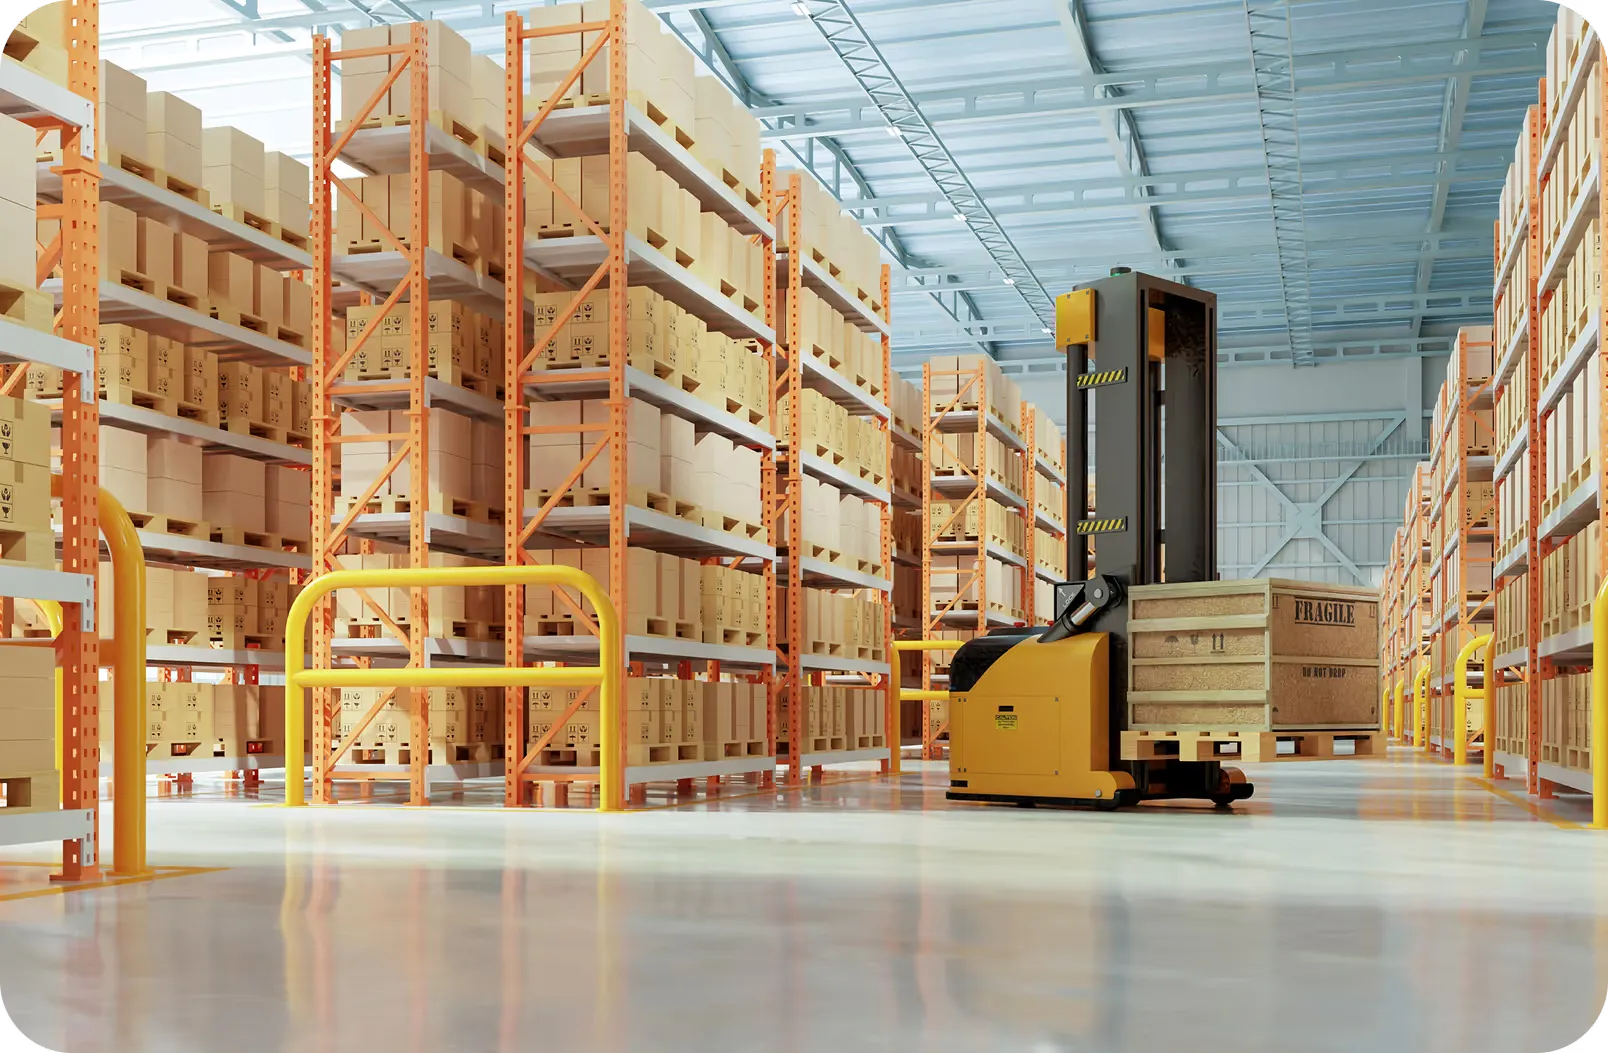
Veri madenciliğinin faydası hemen hemen her sektöre yayılır; çıplak gözle görülmeyen kalıpları ortaya çıkararak verimliliği ve inovasyonu artırır.
Link to this sectionÜretim ve Kalite Kontrol#
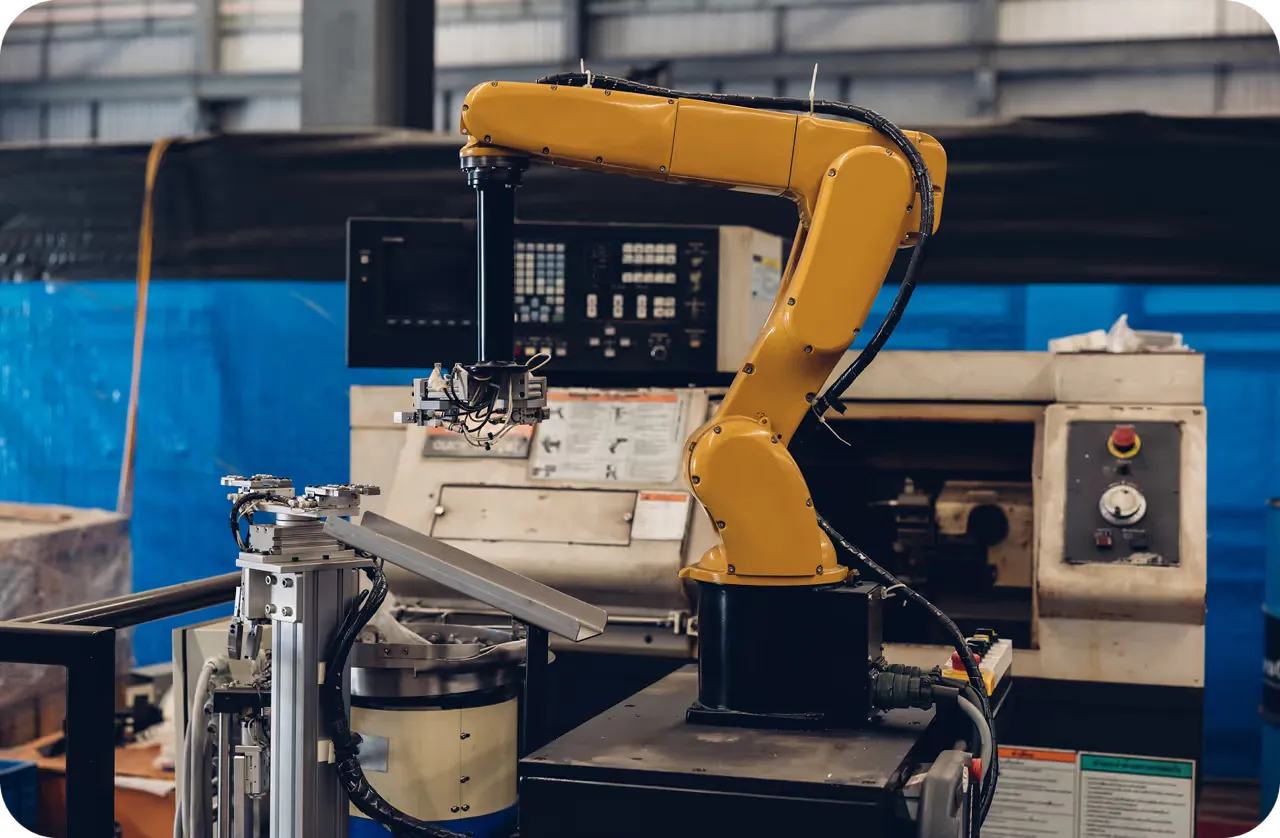
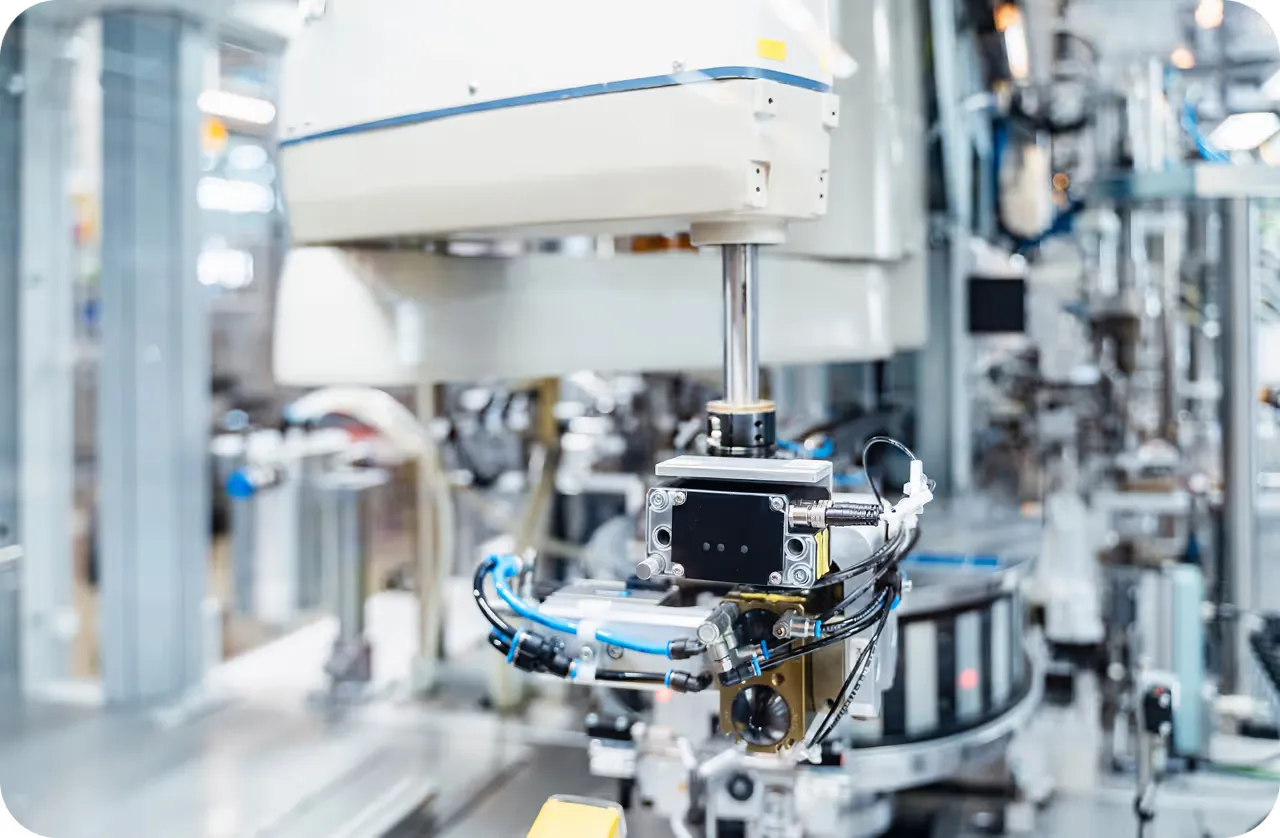
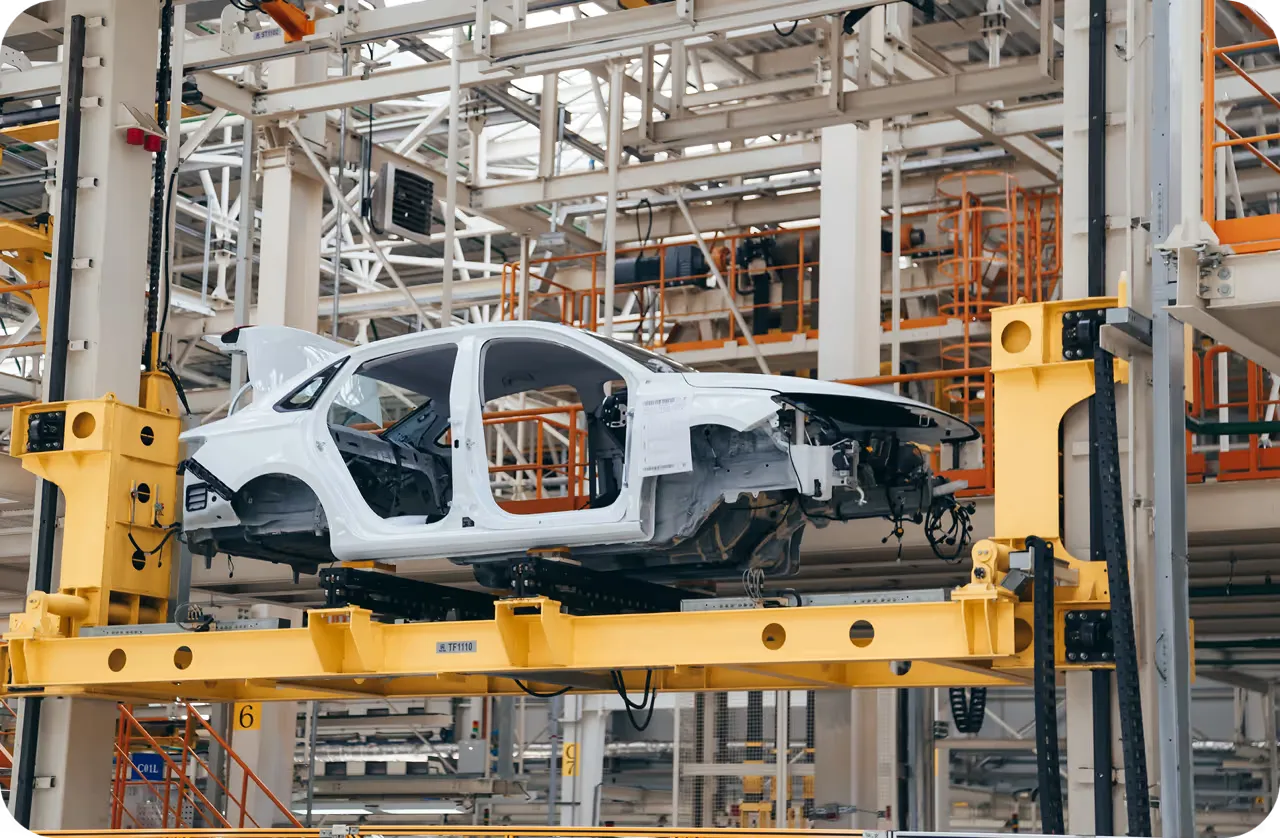
Akıllı üretim bağlamında veri madenciliği, makinelerden gelen sensör verilerini analiz etmek için kullanılır. Tahminleyici bakım algoritmaları uygulayarak fabrikalar, ekipman arızalarını gerçekleşmeden önce tahmin edebilir. Ayrıca, YOLO26 gibi bilgisayarlı görü modelleri, tekrarlayan hata türlerini belirlemek için madenciliği yapılan çıkarım günlükleri oluşturabilir ve mühendislerin atıkları azaltmak için üretim süreçlerini ayarlamalarına yardımcı olur.
Link to this sectionSağlık Hizmetleri Tanılaması#
Veri madenciliği, elektronik sağlık kayıtlarını ve tıbbi görüntülemeyi analiz ederek sağlık hizmetlerini dönüştürür. Araştırmacılar, belirli gen dizileri ile hastalıklar arasındaki ilişkileri bulmak için genomik verileri madencilik yöntemiyle işler. Radyolojide, büyük röntgen veri kümelerinin madenciliği, zatürre veya tümör gibi durumların erken belirtilerini tanımlamaya yardımcı olur ve bu da tıbbi görüntü analizi süreçlerini destekler.
Link to this sectionİlgili Terimlerin Ayrıştırılması#
Veri madenciliğini tam olarak anlamak için onu veri bilimi dünyasındaki yakından ilişkili kavramlardan ayırmak faydalıdır.
- Veri Madenciliği ve Makine Öğrenimi: Birbirleriyle örtüşseler de, veri madenciliği mevcut kalıpları keşfetmeye odaklanırken, makine öğrenimi bu kalıpları öğrenmek ve gelecekteki sonuçları tahmin etmek için kullanmaya odaklanır. Madencilik genellikle ML modelleri için özellik mühendisliğini bilgilendiren keşif aşamasıdır.
- Veri Madenciliği ve Veri Görselleştirme: Görselleştirme, verilerin grafiksel temsilidir (çizelgeler, grafikler). Madencilik ise görselleştirilecek içgörüleri üreten analitik süreçtir. Tableau gibi araçlar genellikle veri madenciliğinin sonuçlarını görselleştirir.
- Veri Madenciliği ve Veri Ambarı: Ambarlama, birden fazla kaynaktan gelen büyük hacimli verilerin merkezi depolanmasını ve yönetimini içerir. Madencilik ise değer elde etmek için o ambarlanmış veriler üzerinde gerçekleştirilen işlemdir.
Link to this sectionUltralytics ile Veri Madenciliği Uygulaması#
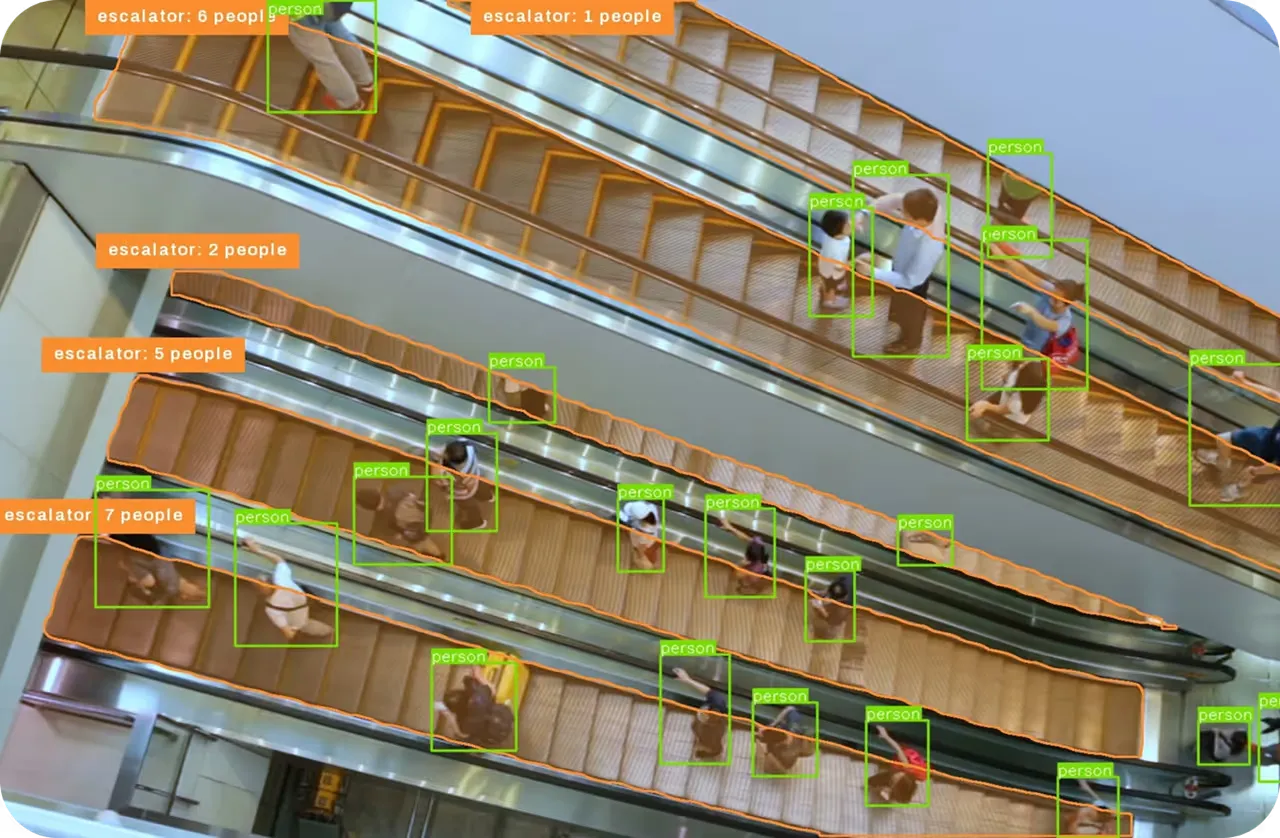
Bir bilgisayarlı görü iş akışında "madencilik", yüksek değerli tespitleri veya zorlu uç durumları bulmak için çıkarım sonuçlarını analiz ederken gerçekleşir. Bu süreç, veri kümelerini yönetmeye ve analiz etmeye yardımcı olan Ultralytics Platform kullanılarak kolaylaştırılır.
Aşağıdaki örnek, bir YOLO26 modeli kullanarak belirli yüksek güvenilirlik oranına sahip tespitleri bulmak için bir görüntü koleksiyonunda nasıl "madencilik" yapılacağını göstermektedir. Bu, ilgili olaylar için devasa veri akışlarını filtreleme sürecini taklit eder.
from ultralytics import YOLO

# Load the YOLO26n model
model = YOLO("yolo26n.pt")

# List of image paths (simulating a dataset)
image_files = ["image1.jpg", "image2.jpg", "image3.jpg"]

# Run inference on the batch
results = model(image_files)

# 'Mine' the results for high-confidence 'person' detections (class 0)
high_conf_people = []
for result in results:
    # Filter boxes where class is 0 (person) and confidence > 0.8
    detections = result.boxes[(result.boxes.cls == 0) & (result.boxes.conf > 0.8)]
    if len(detections) > 0:
        high_conf_people.append(result.path)

print(f"Found high-confidence people in: {high_conf_people}")
Bu kod parçacığı temel bir madencilik operasyonunu göstermektedir: ham tahminleri filtreleyerek bir ilgi alt kümesi çıkarmak (yüksek kesinlikle tanımlanmış insanları içeren görüntüler) ve ardından bu görüntüleri model performansını daha da artırmak amacıyla aktif öğrenme için kullanmak.