Inter-rater reliability: Definition, examples, calculations
Understand inter-rater reliability, Cohen's Kappa, ICC, rater training and percentage agreement. Learn how these statistical measures ensure consistency and agreement among observers in research and data analysis.
When you are building an AI model, the quality of your data is just as important as the algorithms behind it. Whenever multiple people label or review the same data, disagreements are bound to happen. This is true across many fields, including research, healthcare, and education.
Particularly, in computer vision, a branch of AI that involves training models like Ultralytics YOLO11 to interpret visual data like images or videos, labeled examples play a crucial role. If those labels are inconsistent, computer vision models can struggle to learn the correct patterns.
Inter-rater reliability (IRR) measures how consistently different individuals, or labelers, agree on a task. It helps monitor consistency and identify gaps in training, guidelines, or interpretation. This is especially important in custom model training, where AI models are built using specific data for a particular purpose.
In this article, we’ll explore what inter-rater reliability is, how to measure it, and how to improve it across real-world projects. Let’s get started!
Link to this sectionWhat is inter-rater reliability?#
Inter-rater reliability measures how often two or more people (also known as raters) agree when labeling, rating, or reviewing the same content. It is used to check how consistently different raters use given criteria. High agreement between raters means that a task is well defined and clearly understood.
This concept is used across different fields. Depending on the field, it is known by different names, such as inter-rater agreement, interobserver reliability, or inter-coder reliability. However, the underlying principle remains the same.
In vision AI, inter-rater reliability is a key part of the data labeling process. Training computer vision models often requires labeling massive datasets of images or video frames, so multiple AI developers work on the same data together.
To get accurate results, they have to follow the same labeling guidelines. For example, when labeling animals, everyone needs a clear agreement on what counts as a dog, how to draw the bounding box around it, and whether to label or ignore blurry objects.
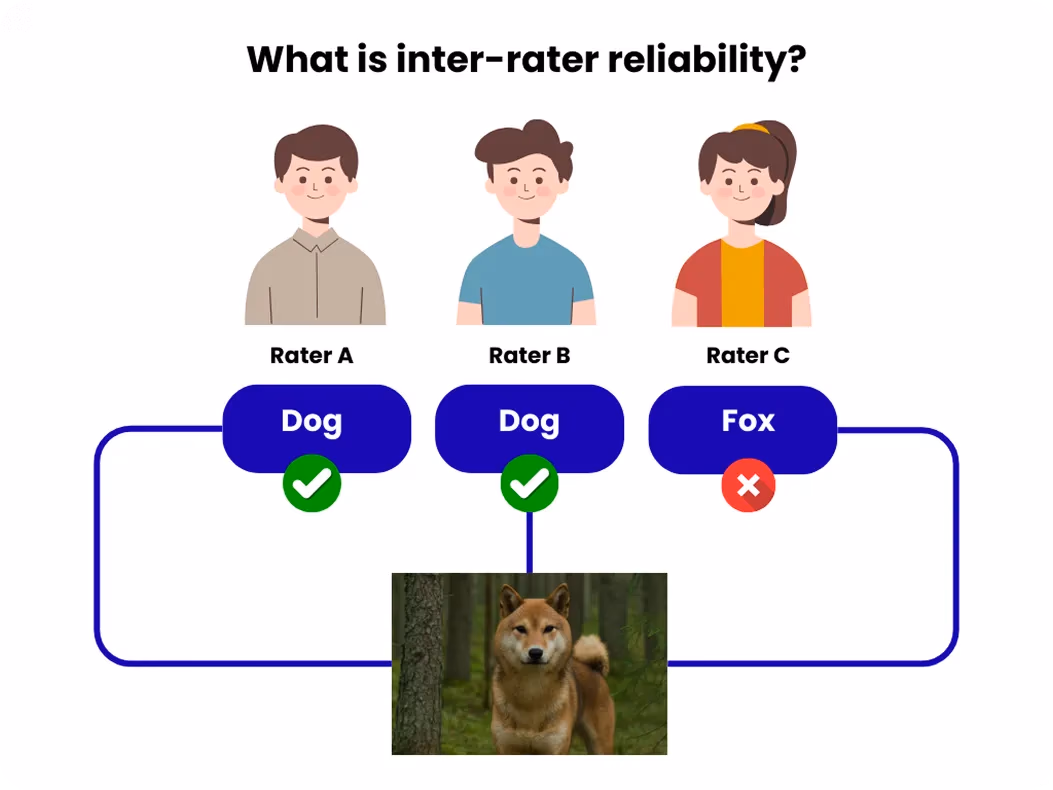
Fig 1. Understanding inter-rater reliability (Image by author)
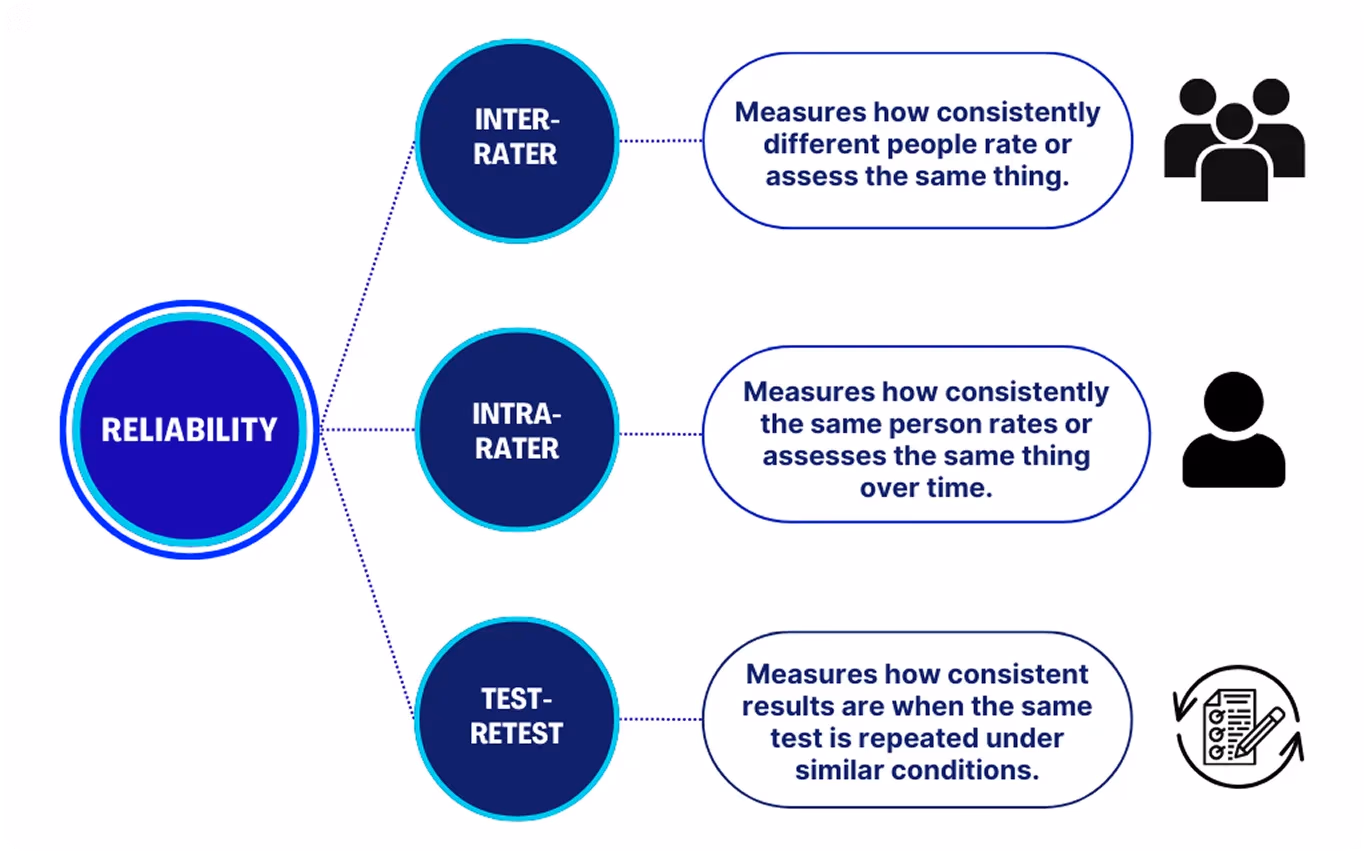
Link to this sectionInter-rater vs. intra-rater reliability and test-retest reliability#
When people are involved in labeling or scoring data, there are three main types of reliability to consider. Each serves a different purpose in measuring how consistent the results are. Here’s a closer look at each one:
-
Inter-rater reliability: Inter-rater reliability looks at how much agreement there is between different people performing the same task. This is especially useful when multiple annotators are involved in projects like image labeling, sentiment analysis, or medical reviews.
-
Intra-rater reliability: It shifts the focus to a single person. Intra-rater reliability checks whether the rater remains consistent when repeating the same task at different points in time. If the labels change too much, it could be the result of unclear guidelines or a lack of task clarity.
-
Test-retest reliability: Test-retest reliability does not focus on the annotator but on the tool or method being used. It measures whether the same result appears when the test is repeated under similar conditions. If the output stays consistent, the method is considered reliable.
Together, these measures help confirm that both people and processes are producing steady, trustworthy results.
Fig 2. An overview of inter-rater, intra-rater, and test-retest reliability (Image by author)
Link to this sectionWhy is inter-rater reliability important?#
In large-scale vision AI projects, the quality of labeled data directly affects how well a model performs. Even small differences in how annotators apply guidelines can introduce inconsistencies that confuse the model during training. Over time, this can lead to inaccurate predictions, wasted resources, and the need for costly re-labeling.
Measuring inter-rater reliability helps spot these problems early. High agreement means that annotators are aligned, producing cleaner and more reliable datasets. Low agreement signals that instructions, examples, or training may need to be refined before the project moves forward. By ensuring labelers work in sync, teams can build AI models that learn more effectively and deliver better results in real-world applications.
Link to this sectionPractical considerations for inter-rater reliability#
Here are some key practical considerations to keep in mind while working with multiple raters and aiming to maintain high inter-rater reliability:
- Ambiguous or subjective tasks: When labeling involves interpretation, such as deciding if a blurry object is a pedestrian or judging the quality of an image, multiple raters help ensure decisions are consistent and not overly influenced by individual bias.
- Simple, objective tasks: Straightforward tasks like counting the number of cars in an image or confirming whether an object is present often require only one well-trained rater, since agreement is typically high once the process is clearly defined.
- Clear labeling guidelines: Detailed, easy-to-follow instructions reduce uncertainty in how labels are applied, which improves agreement across raters. Guidelines should explicitly cover edge cases to prevent inconsistent interpretations.
- Periodic training and calibration: Even experienced raters can drift in their judgments over time. Regular training sessions and calibration checks help maintain consistency and minimize experimenter bias.
Link to this sectionMeasures of inter-rater reliability#
There are several ways to measure inter-rater reliability, and the best choice depends on the type of data and task. Some methods work well for single raters handling simple yes-or-no questions, while others are designed for situations involving multiple raters.
Common approaches include percent agreement, Cohen’s Kappa, Fleiss’ Kappa, and the intraclass correlation coefficient. Each method measures the level of agreement between raters and accounts for the possibility that some agreement may occur by chance.
Link to this sectionCohen’s Kappa and Fleiss’ Kappa#
Cohen’s Kappa is a widely used method for measuring inter-rater reliability between two raters. It calculates how often they agree on a task, while adjusting for the possibility that some agreement could occur by chance. Scores range from -1 to 1, with 1 indicating perfect agreement and 0 meaning the agreement is no better than random guessing.
Similarly, Fleiss’ Kappa is used when more than two raters are involved. It provides an overall score that shows how consistent the group is. Both methods are used for tasks with set categories, like labeling images or tagging emotions. They are easy to calculate and supported by most annotation tools.
Link to this sectionPercent agreement and intraclass correlation coefficient (ICC)#
Another way to measure inter-rater reliability is percent agreement, which calculates the percentage of times raters make the same decision. While simple to use, it does not account for agreement that might occur by chance.
Meanwhile, the intraclass correlation coefficient is a more advanced method used for continuous or scale-based data. It measures how consistent ratings are across multiple raters and is often applied in research that involves scores, measurements, or other data types beyond fixed categories.
Link to this sectionInter-rater reliability examples and applications#
Now that we have a better understanding of how to measure inter-rater reliability, let’s walk through how these methods can be used in real-world applications.
Link to this sectionInter-rater reliability in medical imaging annotation#
When it comes to medical imaging, even minor differences in interpretation can lead to significant changes in outcomes. For instance, radiologists are often asked to identify patterns that are subtle, ambiguous, or difficult to define. When those patterns become training data for AI systems, the stakes are higher. If experts label the same scan differently, the model may learn the wrong patterns or fail to learn altogether.
Inter-rater reliability helps teams dealing with such data evaluate how consistent expert judgments really are. For example, in a recent study focused on retinal OCT scans, two raters labeled 500 images.
Agreement was high for clear features like drusen (yellow deposits under the retina), with a kappa score of 0.87. But for harder-to-define elements like hyperreflective foci (small, bright spots seen in retinal scans), the score dropped to 0.33. This shows that clearer, more well-defined features tend to produce more consistent expert judgments, while ambiguous ones leave more room for interpretation.
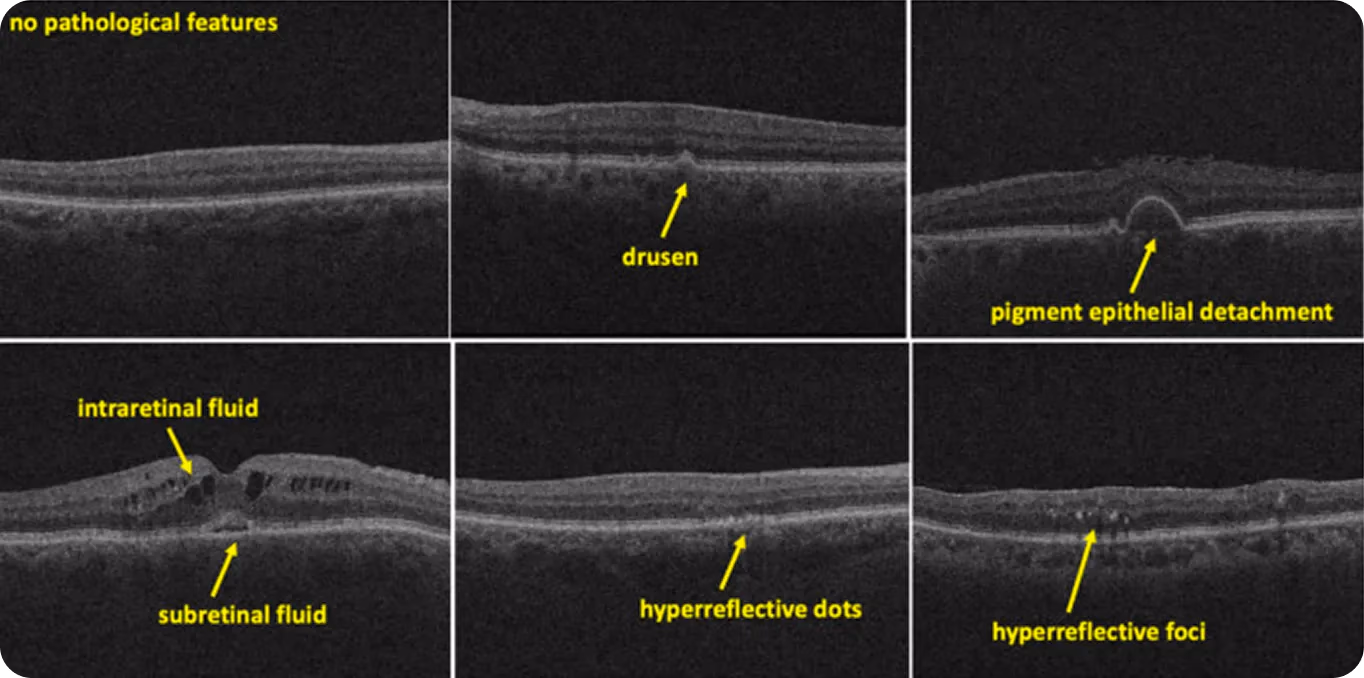
Fig 3. Examples of labels for different features related to retinal diseases (Source)
Link to this sectionAutonomous vehicle datasets and inter-rater reliability#
Training AI models for an autonomous driving system depends on accurate, consistent labels across a wide range of road conditions. Annotators working on such projects are typically asked to identify pedestrians, vehicles, traffic signs, and lane markings, often in poor lighting or crowded scenes.
These decisions shape how the model learns to respond in harsh real-world environments. Inter-rater reliability makes it possible for teams to check whether those labels are being applied the same way across annotators.
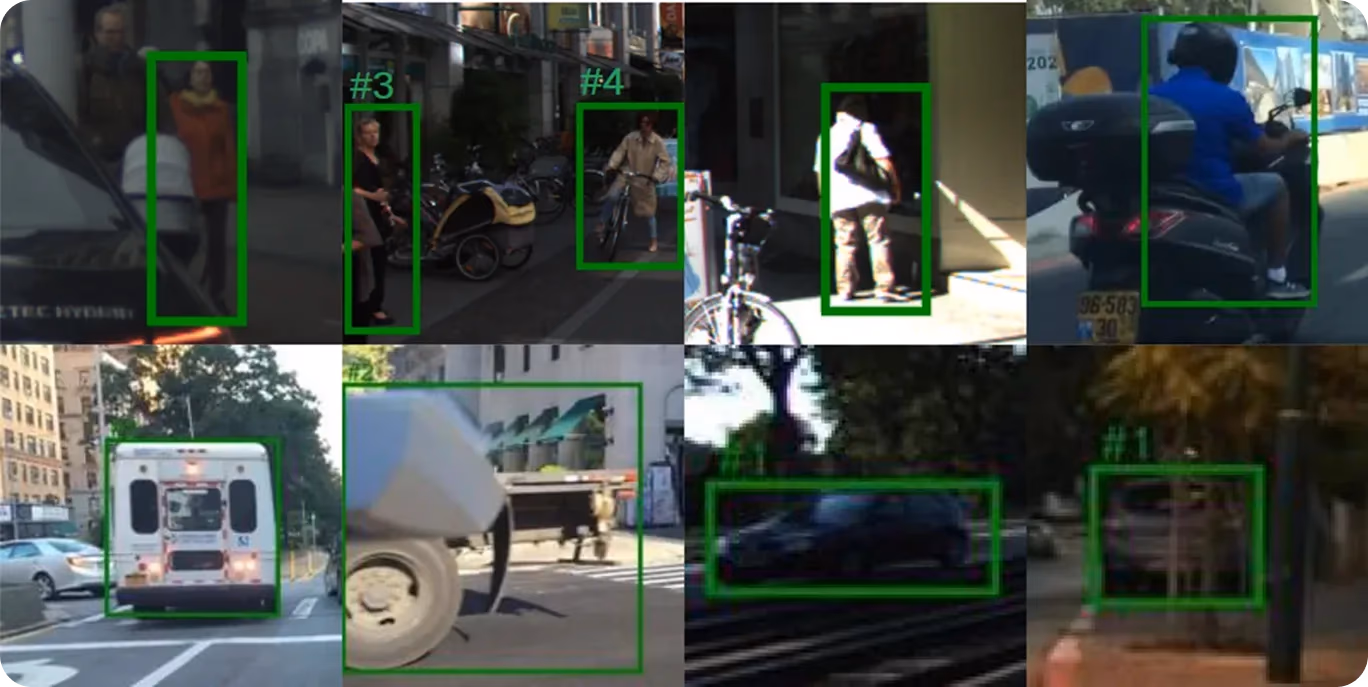
Fig 4. A look at annotation disagreements (Source)
Link to this sectionBeyond inter-rater reliability: Other quality assurance measures#
While measuring inter-rater reliability is a crucial step in building an AI solution, it is a part of a broader quality assurance process. Here are some other practices that can help improve data quality across teams and projects:
- Clear annotation guidelines: Instructions should explain exactly how to apply labels so that everyone is working from the same standard.
- Training and calibration: Regular sessions help annotators stay aligned and give them space to ask questions and adjust to edge cases.
- Ongoing quality checks: Spot checks and gold standard examples can catch mistakes early and keep quality high as the project scales.
- Disagreement resolution: When annotators disagree, there should be a clear process for reviewing those cases and making final decisions.
- Diverse annotator pool: Involving people with different backgrounds can reduce bias and improve how well the dataset represents real-world variation.
Link to this sectionKey takeaways#
Inter-rater reliability measures how consistently people apply labels or make decisions. Methods like Cohen’s Kappa, Fleiss’ Kappa, and ICC help quantify that agreement. With clear guidelines, training, and bias control, reliable annotations lead to stronger data and better model outcomes.
Join our community and explore our GitHub repository to discover more about AI. If you're looking to start your own vision AI project, check out our licensing options. You can also see how AI in healthcare and vision AI in retail are making an impact by visiting our solutions pages.


