Observability
Explore the importance of observability in AI and ML. Learn how to debug complex systems, monitor Ultralytics YOLO26 performance, and gain deep model insights.
Observability refers to the capability of understanding the internal state of a complex system based solely on its
external outputs. In the rapidly evolving fields of
Artificial Intelligence (AI)
and Machine Learning (ML), observability goes beyond simple status checks to provide deep insights into why a model behaves in a
certain way. As modern
Deep Learning (DL)
architectures—such as the state-of-the-art
YOLO26—become increasingly sophisticated, they can often function as "black boxes." Observability tooling creates
a transparent window into these systems, allowing engineering teams to debug unexpected behaviors, trace the root
causes of errors, and ensure reliability in production environments.
Observability vs. Monitoring
While often used interchangeably, observability and
model monitoring serve distinct
but complementary purposes within the
MLOps lifecycle.
-
Model Monitoring
is reactive and focuses on "known unknowns." It involves tracking predefined metrics like
inference latency, CPU usage, or error rates against established thresholds. Monitoring answers the question: "Is the system
healthy?"
-
Observability is proactive and addresses "unknown unknowns." It provides granular
data—logs, traces, and high-cardinality events—needed to investigate novel issues that were not anticipated during
the training data preparation. As
described in the
Google SRE Book, an observable system enables you to understand new behaviors without shipping new code. It answers the question:
"Why is the system acting this way?"
The Three Pillars of Observability
To achieve true observability in
Computer Vision (CV) pipelines,
systems typically rely on three primary types of telemetry data:
-
Logs: Timestamped, immutable records of
discrete events. In a detection pipeline, a log might capture the input image resolution or the specific
hyperparameter tuning
configuration used during a run. Structured logging, often in
JSON format, allows for complex querying
and analysis.
-
Metrics: Aggregated numerical data measured over time, such as average
precision, memory consumption, or
GPU utilization.
Tools like Prometheus and
Grafana are standard for storing these time-series data to
visualize trends.
-
Traces: Tracing follows the lifecycle of a request as it flows through various microservices. For
distributed AI applications, standards like
OpenTelemetry help map the path of a request, highlighting
bottlenecks in the
inference engine or network
delays. Specialized tools like Jaeger helps visualize
these distributed transactions.
Implementing Observability in Python
You can enhance observability in your training pipelines by using callbacks to log specific internal states. The
following example demonstrates how to add a custom callback to a
YOLO26 training session to monitor
performance metrics in real-time.
from ultralytics import YOLO

# Load the YOLO26 model
model = YOLO("yolo26n.pt")


# Define a custom callback for observability
def on_train_epoch_end(trainer):
    # Access and print specific metrics at the end of each epoch
    map50 = trainer.metrics.get("metrics/mAP50(B)", 0)
    print(f"Observability Log - Epoch {trainer.epoch + 1}: mAP50 is {map50:.4f}")


# Register the callback and start training
model.add_callback("on_train_epoch_end", on_train_epoch_end)
model.train(data="coco8.yaml", epochs=3)
Real-World Applications
Observability is critical for deploying high-performance models in dynamic environments where
test data might not perfectly match
real-world conditions.
-
Autonomous Vehicles: In the development of
autonomous vehicles, observability allows engineers to reconstruct the exact state of the system during a disengagement event. By
correlating
object detection outputs with
sensor logs and control commands, teams can determine if a braking error was caused by sensor noise, a model
prediction fault, or a logic error in the planning module.
-
Healthcare Diagnostics: In
AI in healthcare, ensuring consistent performance is vital for patient safety. Observability tools can detect
data drift if a model's performance
degrades when applied to images from a new type of MRI scanner. Traces can reveal if the issue stems from a change
in image
data preprocessing or a shift
in the input distribution, enabling rapid remediation without compromising
AI safety.
Integration with Modern Tools
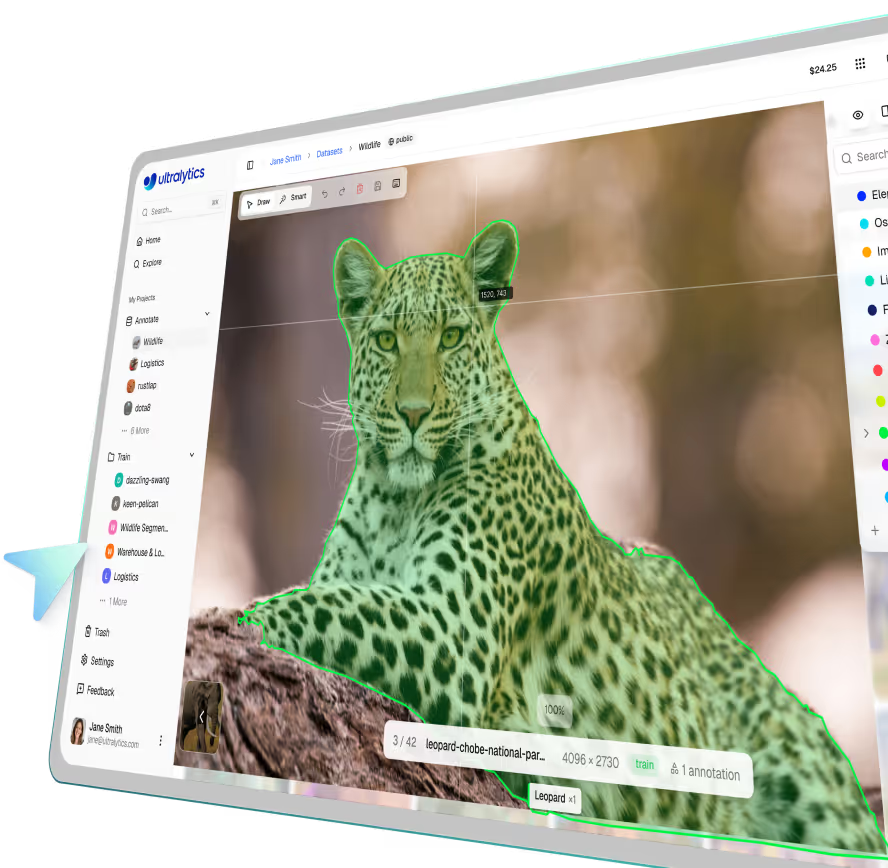
Modern workflows often integrate observability directly into the training platform. Users of the
Ultralytics Platform benefit from built-in
visualization of loss curves, system performance, and dataset analysis. Additionally, standard integrations with tools
like TensorBoard and
MLflow allow data scientists to
maintain rigorous experiment tracking and observability across the entire model lifecycle.


