Mean Average Precision (mAP)
Mean Average Precision(mAP)이 컴퓨터 비전 모델을 어떻게 평가하는지 알아보십시오. IoU, 정밀도, 재현율을 탐색하고 오늘 Ultralytics YOLO26으로 mAP를 계산해 보십시오.
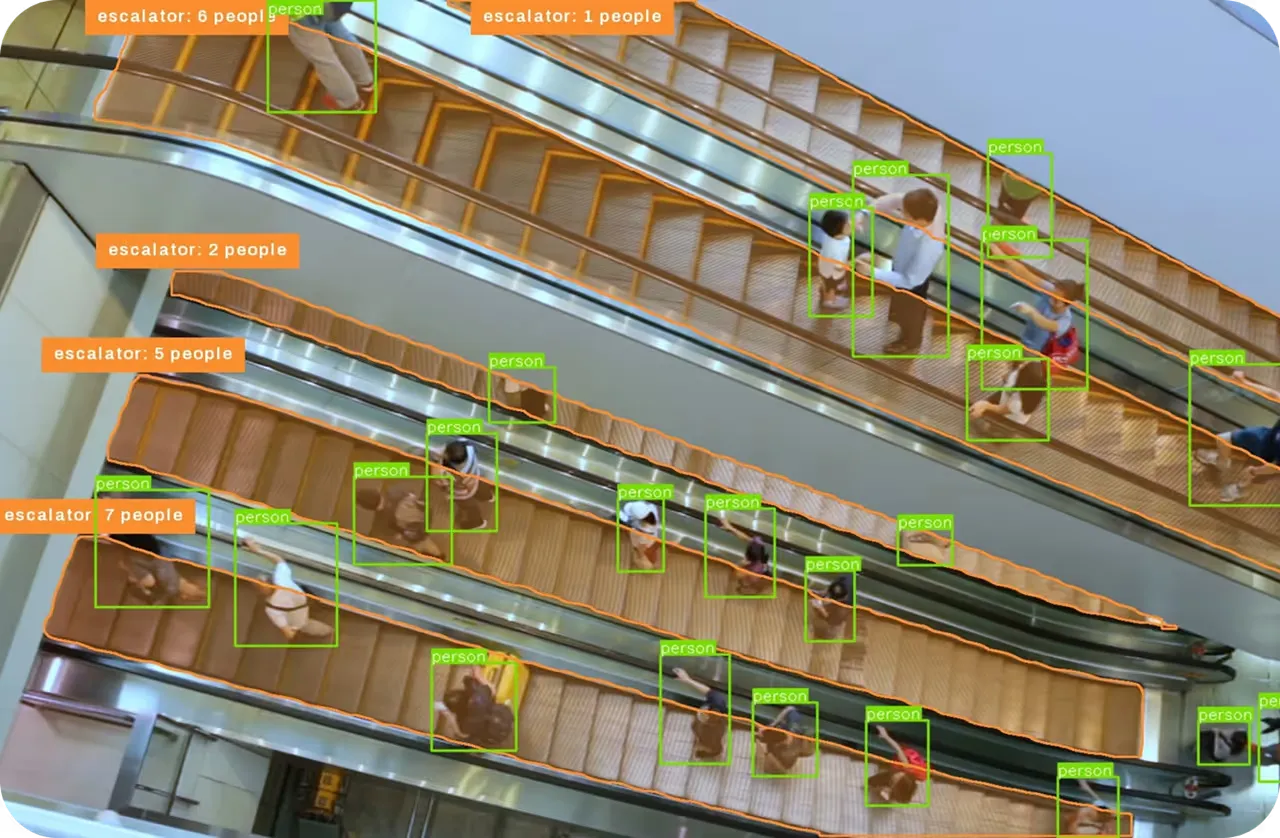
Mean Average Precision (mAP)은 computer vision 모델의 성능을 평가하기 위해 널리 사용되는 포괄적인 지표로, 특히 object detection 및 instance segmentation과 같은 작업에서 사용됩니다. 단순히 이미지가 올바르게 분류되었는지 확인하는 일반적인 정확도(Accuracy)와 달리, mAP는 모델이 객체를 얼마나 잘 찾는지, 그리고 객체 주변의 bounding box를 얼마나 정확하게 위치시키는지 평가합니다. 이로 인해 mAP는 YOLO26과 같은 최신 아키텍처를 이전 세대와 비교하는 주요 벤치마크가 됩니다. 모든 클래스에 걸쳐 정밀도(Precision)와 재현율(Recall) 간의 균형을 요약함으로써, mAP는 실제 환경에서의 모델 견고성을 반영하는 단일 점수를 제공합니다.
Link to this sectionmAP의 구성 요소#
mAP를 계산하려면 먼저 탐지 품질을 정의하는 세 가지 기본 개념을 이해해야 합니다:
- Intersection over Union (IoU): 이는 예측된 박스와 ground truth 어노테이션 간의 공간적 중첩 정도를 측정합니다. 이는 0에서 1 사이의 비율로 나타납니다. 예측은 종종 IoU가 0.5 또는 0.75와 같은 특정 임계값을 초과할 때만 "True Positive"로 간주됩니다.
- Precision: 이 지표는 "모델이 탐지했다고 주장한 모든 객체 중, 실제로 올바른 비율은 얼마인가?"라는 질문에 답합니다. 높은 정밀도는 모델이 false positives를 거의 생성하지 않음을 의미합니다.
- Recall: 이 지표는 "이미지에 실제로 존재하는 모든 객체 중, 모델이 찾은 비율은 얼마인가?"라는 질문에 답합니다. 높은 재현율은 모델이 false negatives를 방지하고 객체를 거의 놓치지 않음을 나타냅니다.
Link to this section계산 방법론#
The calculation begins by computing the Average Precision (AP) for each specific class (e.g., "person," "car," "dog"). This is done by finding the area under the Precision-Recall Curve, which plots precision against recall at various confidence thresholds. The "Mean" in Mean Average Precision simply refers to averaging these AP scores across all categories in the training data.
COCO dataset과 같은 표준 연구 벤치마크는 자주 두 가지 주요 변형을 보고합니다:
-
mAP@50: 이는 IoU가 0.50 이상일 때 탐지가 정확하다고 간주합니다. 이는 관대한 지표입니다.
-
mAP@50-95: 이는 0.05 단계로 0.50에서 0.95까지의 IoU 임계값에서 계산된 mAP의 평균입니다. 이 엄격한 지표는 높은 localization accuracy를 달성한 모델에 높은 점수를 부여합니다.
Link to this sectionmAP와 관련 지표 비교#
mAP를 Accuracy와 구분하는 것이 중요합니다. 정확도는 전체 이미지에 대해 단일 레이블을 출력하는 image classification에는 적합하지만, 객체의 공간적 위치나 배경 클래스를 고려하지 않기 때문에 객체 탐지에는 실패합니다. 마찬가지로, F1-Score는 단일 confidence 임계값에서 정밀도와 재현율의 조화 평균을 제공하지만, mAP는 모든 confidence 수준에 걸쳐 성능을 통합하여 모델 안정성에 대한 보다 전체적인 관점을 제공합니다.
Link to this section실제 애플리케이션 사례#
높은 mAP 점수는 안전과 효율성이 가장 중요한 환경에서 매우 중요합니다.
- Autonomous Vehicles: 자율 주행 기술에서 안전은 높은 재현율(아무것도 놓치지 않음)과 높은 정밀도(유령 제동 방지)로 보행자와 교통 표지판을 탐지하는 것에 달려 있습니다. mAP는 인식 시스템이 이러한 요구 사항의 균형을 효과적으로 맞추도록 보장합니다.
- Medical Image Analysis: X-ray에서 종양이나 골절을 식별할 때 방사선 전문의는 잠재적인 문제를 표시하기 위해 AI in healthcare에 의존합니다. 높은 mAP 점수는 모델이 의사에게 잘못된 경보로 부담을 주지 않으면서 이상 징후를 안정적으로 강조하여 정확한 진단을 용이하게 함을 나타냅니다.
Link to this sectionUltralytics로 mAP 측정하기#
현대적인 프레임워크는 validation 단계에서 이러한 지표 계산을 단순화합니다. 다음 예제는 ultralytics Python 패키지를 사용하여 모델을 로드하고 mAP를 계산하는 방법을 보여줍니다.
from ultralytics import YOLO

# Load the YOLO26 model (recommended for new projects)
model = YOLO("yolo26n.pt")

# Validate the model on a dataset to compute mAP
# This runs inference and compares predictions to ground truth
metrics = model.val(data="coco8.yaml")

# Print mAP@50-95 (map) and mAP@50 (map50)
print(f"mAP@50-95: {metrics.box.map:.3f}")
print(f"mAP@50: {metrics.box.map50:.3f}")
mAP를 이해하고 최적화하는 것은 model deployment 이전에 필수적입니다. 이 프로세스를 간소화하기 위해 Ultralytics Platform은 훈련 중 mAP, 손실 곡선 및 기타 KPI를 자동으로 추적하여 개발자가 진행 상황을 시각화하고 프로덕션을 위한 최상의 모델 체크포인트를 선택할 수 있도록 합니다.