Ultralytics Platform Monitoring: Keep vision AI deployments on track
Monitor deployed vision AI models with Ultralytics Platform. Track endpoint health, latency, errors, logs, and live prediction statistics.
Deploying a computer vision model is an important milestone, but production success depends on what happens next. As traffic grows and real-world conditions change, teams need to know whether endpoints remain responsive, reliable, and useful.
Monitoring in Ultralytics Platform gives teams visibility into deployed Ultralytics YOLO models from the same environment used to manage data, training, and deployment. Track operational health, inspect prediction trends, troubleshoot issues, and turn useful production examples into data for future model improvements.
What is vision AI model monitoring?#
Vision AI model monitoring helps teams understand how deployed endpoints and their predictions behave in production.
Ultralytics Platform addresses two important questions:
- Is the endpoint operating reliably? Track requests, P95 latency, error rates, health status, and logs.
- What is the model seeing and predicting? Inspect sample predictions and statistics such as class counts, confidence, inference time, and prediction locations where supported.
Together, these insights provide a clearer picture than endpoint availability alone. An endpoint can remain online while traffic patterns, response times, or prediction distributions change. Monitoring makes those signals easier to investigate.
Understand deployment health at a glance#
The Deploy page serves as a central monitoring dashboard for your endpoints. Overview cards summarize HTTP requests, active deployments, error rates, and P95 latency over the previous 24 hours.
With these metrics, teams can:
- Understand demand: See whether endpoint traffic is increasing, declining, or changing unexpectedly.
- Identify performance issues: Use P95 latency to investigate slower responses that could affect an application.
- Surface failures: Spot elevated HTTP error rates and use deployment logs to diagnose the cause.
- Check availability: Confirm whether individual endpoints are healthy and responding.
- Compare deployments: Review endpoints through card, compact, or sortable table views.
The error-rate card is highlighted when the rate exceeds 5%, helping operational issues stand out without requiring teams to inspect every endpoint individually.
Troubleshoot faster with health checks and logs#
When an endpoint experiences problems, teams need more than a high-level metric. Each ready deployment includes a health indicator and access to recent logs.
Health checks show whether an endpoint is responding and report its response latency. They can also help warm up an endpoint that has scaled to zero before production traffic is sent.
Logs provide additional context through timestamps, severity levels, messages, and HTTP details. This helps teams investigate failed requests, unexpected responses, or performance changes without immediately moving to a separate logging interface.
By connecting metrics, health checks, and logs to each deployment, Ultralytics Platform creates a more direct path from identifying an issue to understanding it.
Inspect live prediction behavior#
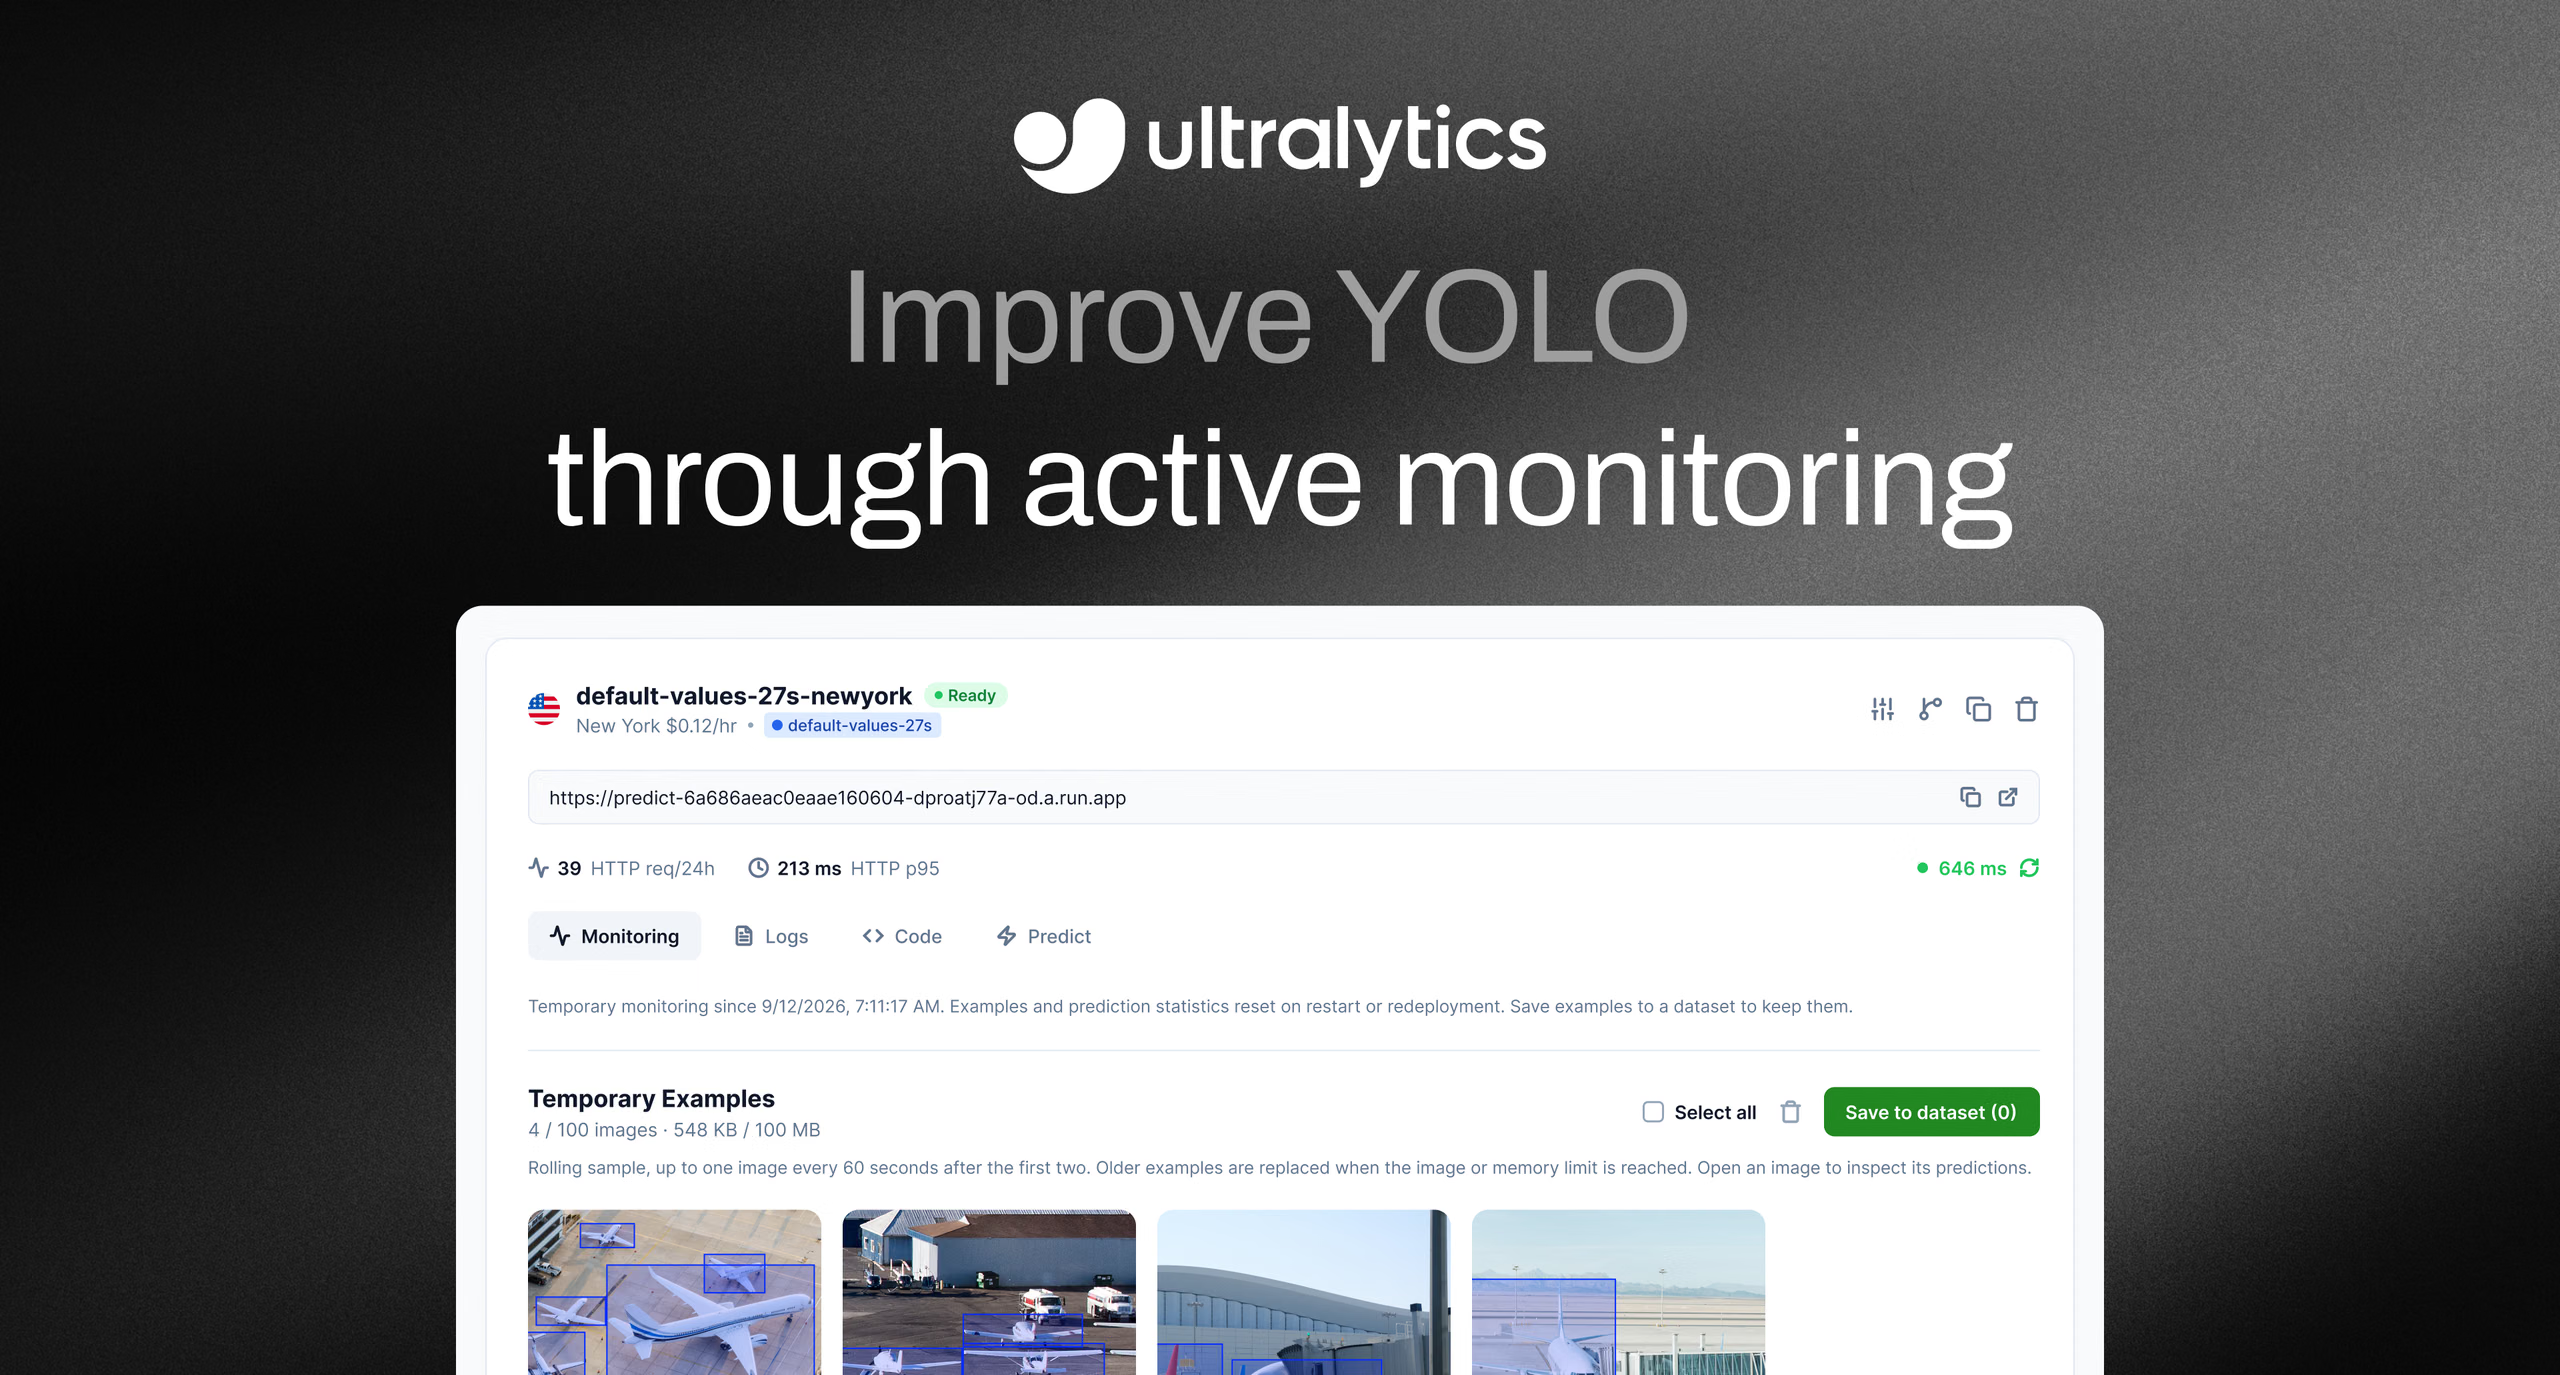
Paid, uptime-billed dedicated endpoints running a monitoring-capable runtime provide an additional Monitoring tab with temporary examples and prediction statistics.
The temporary examples gallery presents a rolling sample of processed images with prediction overlays. Teams can use these examples to spot-check what a model is seeing, inspect its outputs, and identify inputs that deserve further review.
Available prediction statistics depend on the model task and can include:
- Processed images and predictions over time
- Mean model inference time
- Frequently predicted classes
- Predictions per image
- Prediction confidence and confidence trends
- Prediction dimensions
- Spatial heatmaps of prediction locations
These signals can reveal changes worth investigating, such as falling confidence, an unexpected shift in class distribution, or predictions appearing in unusual parts of an image.
Confidence indicates model certainty, not correctness. Teams should inspect examples and compare predictions with reviewed labels when evaluating model accuracy.
Turn production examples into better training data#
Monitoring becomes more valuable when production insights can inform the next development cycle.
If an example reveals a difficult condition, unusual object, or potential coverage gap, workspace members with the appropriate permissions can save it directly to a compatible dataset. The image and its predictions then pass through the standard dataset ingestion workflow, where labels can be reviewed before the data is used for training.
This creates a connected improvement loop:
- Train an Ultralytics YOLO model using your dataset.
- Deploy it to a dedicated endpoint.
- Monitor endpoint health and prediction behavior.
- Inspect useful or problematic production examples.
- Save and review selected examples in a dataset.
- Retrain and redeploy using data informed by real-world conditions.
Instead of leaving production observations isolated in another system, teams can connect them to the datasets and models already managed in Ultralytics Platform.
Built for operational visibility without added complexity#
Production computer vision workflows often involve separate systems for deployment, metrics, logs, model inspection, and data management. Moving between those systems can slow investigation and make it harder to connect model behavior with future improvements.
Ultralytics Platform brings these stages together. Teams can move from training to deployment, review endpoint health, inspect sampled predictions, and save useful examples without rebuilding context across multiple tools.
For example, a manufacturing team could inspect whether defect predictions are appearing in expected areas of an image. A logistics team could review changes in frequently detected classes as operational conditions evolve. A retail team could investigate a latency increase and determine whether endpoint configuration or incoming image size needs attention.
In each case, monitoring helps teams move from “something changed” to a more informed next step.
Monitoring data and eligibility#
Operational monitoring, including requests, latency, errors, health checks, and logs, is available from the deployment experience.
Live prediction statistics and temporary examples require a ready, paid dedicated endpoint with a monitoring-capable runtime. Older endpoints may need to be updated before the Monitoring tab becomes available.
Prediction examples and statistics are held in the serving instance’s memory. They can be cleared when an endpoint stops, restarts, redeploys, changes resources, or replaces its model. Save any examples you want to retain to a dataset before changing the endpoint.
Start monitoring your deployed models#
Ultralytics Platform Monitoring gives teams the visibility needed to manage vision AI beyond deployment. By bringing endpoint metrics, logs, health checks, prediction insights, and dataset feedback into one workflow, it helps teams identify issues faster and build a clearer path toward reliable production systems.
Sign in to Ultralytics Platform, open Deploy, and select a ready endpoint to review its health and performance. Explore feature availability, prediction statistics, and data-retention details in the Monitoring documentation.