Data Analytics
Data analytics examines data to answer questions and guide decisions, from descriptive reports to predictive and prescriptive models and video analytics.
Data analytics is the practice of examining data to answer questions and support decisions. It covers collecting and cleaning data, analyzing it with statistics and machine learning, and communicating the results through reports, dashboards, and data visualization. A retailer asking which stores lost sales last quarter, a hospital estimating next week's admissions, and a city counting cars at an intersection from camera feeds are all doing data analytics.
The Four Types of Analytics#
Analytics is commonly divided by the question it answers, and each type builds on the one before:
- Descriptive analytics: What happened? Totals, averages, distributions, and trends summarize past data, the staple of business reports.
- Diagnostic analytics: Why did it happen? Drill-downs, correlations, and comparisons between segments look for causes.
- Predictive analytics: What will happen? Statistical and machine learning models forecast outcomes such as demand, churn, or equipment failure.
- Prescriptive analytics: What should be done? Optimization and simulation turn forecasts into recommended actions, such as how many checkout lanes to open.
The first three fit in a few lines of pandas and scikit-learn on the diabetes dataset bundled with scikit-learn, which records 10 baseline measurements for 442 patients and a disease progression score one year later:
from sklearn.datasets import load_diabetes
from sklearn.linear_model import LinearRegression
from sklearn.model_selection import train_test_split

# 442 diabetes patients: 10 baseline measurements and a disease progression score one year later
data = load_diabetes(as_frame=True).frame

# Descriptive: how far did the disease progress?
print(f"progression: mean {data['target'].mean():.0f}, range {data['target'].min():.0f}-{data['target'].max():.0f}")

# Diagnostic: which measurements move with progression?
print(data.corr()["target"].drop("target").nlargest(3).round(2).to_dict())

# Predictive: how well do the measurements forecast progression for new patients?
X_train, X_test, y_train, y_test = train_test_split(data.drop(columns="target"), data["target"], random_state=0)
model = LinearRegression().fit(X_train, y_train)
print(f"R^2 on held-out patients: {model.score(X_test, y_test):.2f}")
The descriptive step reports a mean progression score of 152 on a range from 25 to 346. The diagnostic step finds that body mass index correlates most strongly with progression (0.59), followed by the serum triglycerides measure s5 (0.57) and blood pressure (0.44). The predictive step explains 36% of the variance in progression for patients the model never saw, an R² of 0.36.
The Analytics Process#
A project starts with a precise question and a metric that answers it, then gathers the relevant data from databases, logs, sensors, or cameras. Data cleaning and data preprocessing fix missing values, duplicates, and inconsistent units, and exploratory analysis plots distributions and relationships before any modeling. Analysts then apply statistics, time series analysis, or data mining algorithms and report the results with their uncertainty. Typical tools are SQL and spreadsheets for small questions, pandas and notebooks for analysis, distributed engines such as Apache Spark for big data, and business intelligence tools such as Tableau and Power BI for dashboards.
Machine learning projects run the same analysis on their own data and models. Before training, class counts and label statistics reveal imbalance and dataset bias; after training, a confusion matrix and per-class metrics show which classes, lighting conditions, or object sizes a model gets wrong.
Video Analytics#
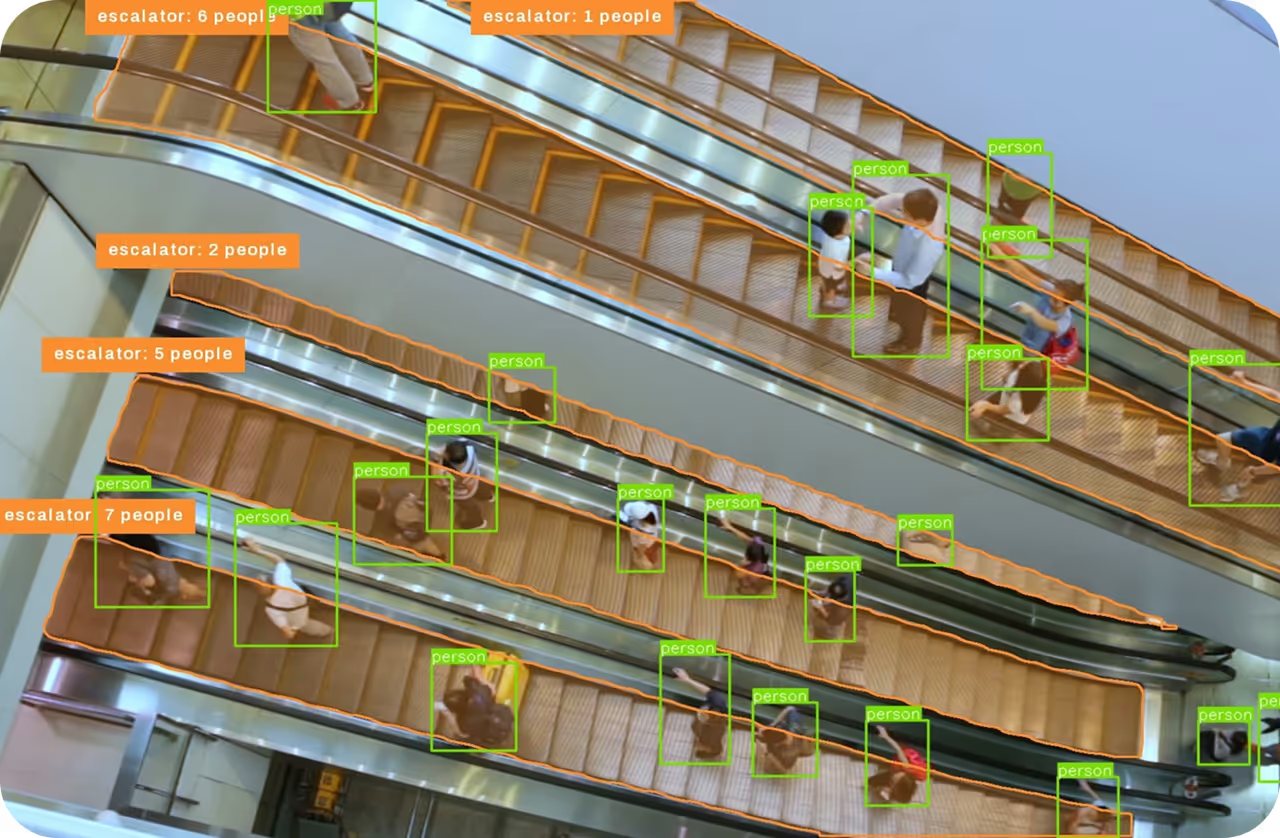
Computer vision turns cameras into data sources for analytics. Object detection and object tracking convert each frame into counts, positions, and trajectories, which aggregate into foot traffic per hour, queue management metrics such as wait times, vehicles per lane, or defect rates per production shift. People counting and occupancy analytics in stores and offices, and traffic management at intersections, both run on this conversion from pixels to tables.
The Ultralytics YOLO Analytics solution performs the conversion in one step: it runs a YOLO26 model with tracking on every frame of a video and draws the results as a live chart, either a line graph of total detections per frame or a bar plot, pie chart, or area plot of counts per class, which can be written to an output video.
Data Analytics vs. Related Terms#
- Data science: A broader field that includes analytics and also builds models and data products, such as recommendation engines, that run in production.
- Business intelligence (BI): Reporting and dashboards over curated company data, mostly descriptive and diagnostic analytics.
- Data mining: The pattern-discovery step within analytics, using algorithms to find associations, clusters, and anomalies in large datasets automatically.