Data Mining
Data mining finds patterns, associations, clusters, and anomalies in large datasets with statistics and machine learning, the analysis step of KDD.
Data mining is the process of discovering useful patterns in large datasets, such as items that occur together, natural groups, predictive rules, and unusual records, using statistics, machine learning, and database techniques. Formally, data mining is the analysis step of knowledge discovery in databases (KDD), which Usama Fayyad, Gregory Piatetsky-Shapiro, and Padhraic Smyth described in 1996 as a sequence of data selection, data preprocessing, transformation, mining, and interpretation of the results.
The Data Mining Process#
A widely used process model is CRISP-DM, the Cross-Industry Standard Process for Data Mining, which a consortium including Teradata, Daimler, and NCR first presented in 1999. Its six phases loop back on each other whenever a later phase exposes a gap in an earlier one:
Data preparation, which includes data cleaning, joining sources, and feature engineering, is typically the longest phase, and modeling sends the team back to it whenever a pattern turns out to be an artifact of missing or duplicated records.
Core Techniques#
- Association rule learning: Finds items or events that occur together, as in market basket analysis. Rakesh Agrawal and Ramakrishnan Srikant's Apriori algorithm from 1994 made it practical on large transaction databases.
- Clustering with k-means or DBSCAN: Groups similar records without labels, such as customer segments or similar images, as a form of unsupervised learning.
- Classification with decision trees: Learns rules that assign records to known categories, such as approving or flagging a loan application, from labeled history.
- Anomaly detection: Flags records that differ sharply from the rest, such as fraudulent card transactions or a machine whose sensor readings drift from normal.
- Sequential pattern mining: Finds ordered patterns, such as the page paths that most often lead to a purchase.
Association rules are scored with three numbers. Support is the share of transactions that contain both items, confidence is the share of transactions with item A that also contain item B, and lift divides confidence by how common B is on its own, so a lift above 1 means A and B occur together more often than chance predicts. This example scores every pair of products in eight shopping baskets with pandas:
from itertools import permutations

import pandas as pd

# Eight shopping baskets, one column per product
baskets = pd.DataFrame(
    [[1, 1, 0, 1], [1, 1, 0, 0], [0, 1, 1, 0], [1, 1, 1, 1], [1, 0, 0, 1], [0, 0, 1, 0], [1, 1, 0, 1], [0, 1, 1, 0]],
    columns=["bread", "butter", "milk", "jam"],
).astype(bool)

# Score every rule "A -> B" and keep frequent rules that beat chance
for a, b in permutations(baskets.columns, 2):
    support = (baskets[a] & baskets[b]).mean()  # share of baskets with both items
    confidence = support / baskets[a].mean()  # share of A baskets that also hold B
    lift = confidence / baskets[b].mean()  # confidence relative to B's base rate
    if support >= 0.25 and lift > 1:
        print(f"{a} -> {b}: support {support:.2f}, confidence {confidence:.2f}, lift {lift:.2f}")
It prints four rules. The rule bread → butter has a high confidence of 0.80 but a lift of only 1.07, because butter is in three of every four baskets anyway, while bread → jam has the same confidence and a lift of 1.60. The rule milk → butter has a confidence of 0.75 and a lift of exactly 1.00, so the filter drops it.
Data Mining in Computer Vision#
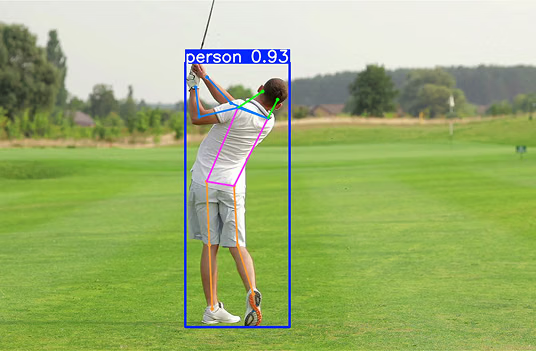
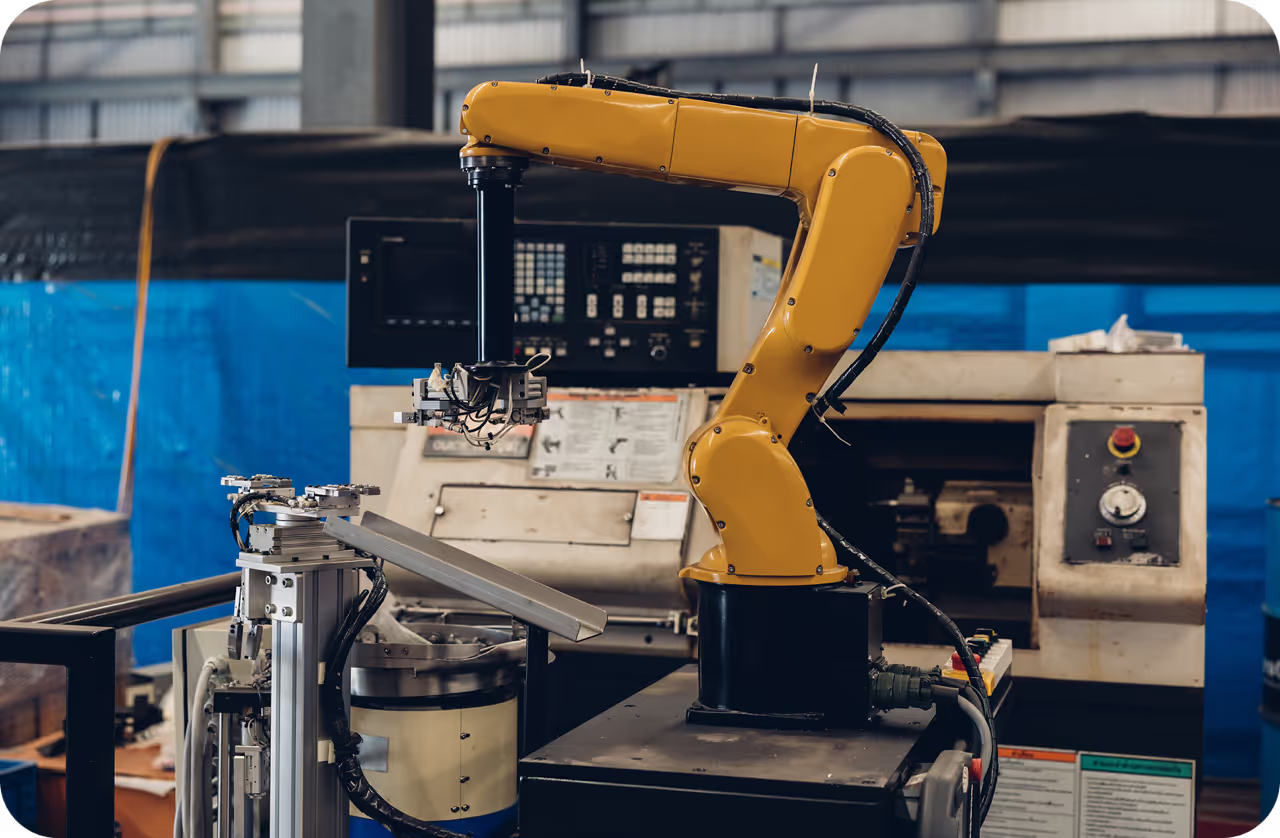
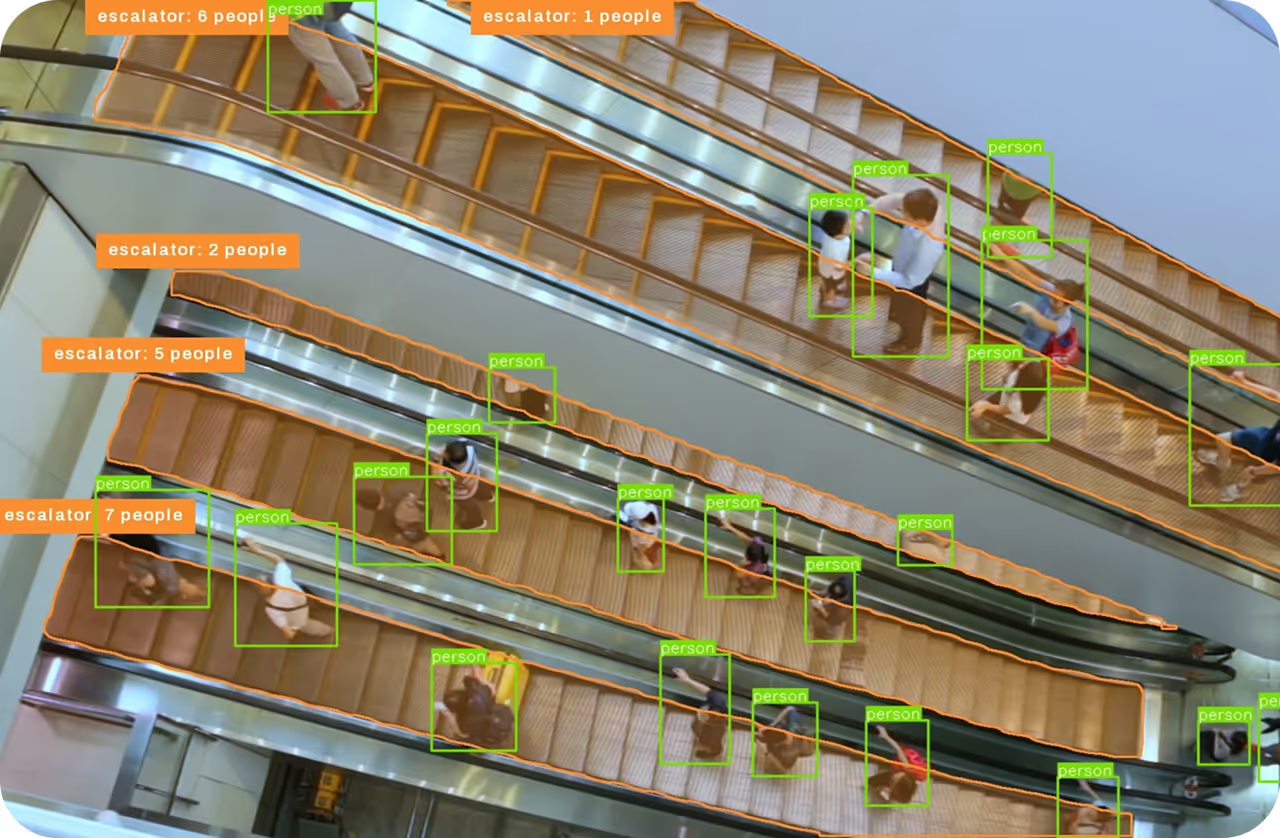
Image and video collections are mined for the examples that matter most to a model. Hard negative mining selects background regions that a detector wrongly scores as objects and trains on them again, and active learning mines unlabeled pools for the images a model is least sure about. Mining a deployed system's detection logs reveals recurring defect types on a manufacturing line or peak hours in a store, and embeddings let teams cluster millions of images by content to find duplicates and gaps.
Ultralytics Platform mines datasets this way with its Clustering panel, which computes an embedding for every image and projects the dataset into an interactive 2D scatter plot where visually similar images sit close together, so users can color points by split, class, or cluster, spot duplicates and outliers, and lasso a region to inspect, relabel, or move those images.
Data Mining vs. Related Terms#
- Machine learning: Builds models that generalize to new data. Data mining applies many of the same algorithms with the goal of describing patterns in existing data.
- Data analytics: The broader practice of answering questions with data, which includes data mining along with reporting and interpretation.
- Data visualization: Presents data and mined patterns graphically so people can read them.
- Web scraping: Collects data from websites. Popular usage sometimes calls this data mining, but in the technical sense mining is the analysis that follows collection.