Model Monitoring
AI におけるモデル監視の重要性を探ります。データドリフトやパフォーマンス指標を追跡し、Ultralytics Platform を使用して Ultralytics YOLO26 を堅牢に保つ方法を学びましょう。
Model monitoring is the ongoing practice of tracking, analyzing, and evaluating the performance of Machine Learning (ML) models after they have been deployed into production. While traditional software typically operates deterministically—expecting the same output for a given input indefinitely—predictive models rely on statistical patterns that can evolve over time. As the real-world environment changes, the data fed into these models may shift, causing degradation in accuracy or reliability. Monitoring ensures that Artificial Intelligence (AI) systems continue to deliver value by identifying issues like data drift or concept drift before they negatively impact business outcomes or user experience.
Link to this sectionデプロイ後の監視の重要性#
Machine Learning Operations (MLOps)のライフサイクルにおいて、デプロイはゴールではありません。履歴データでトレーニングされたモデルは、特定の時点における世界の断面図を表しています。時間の経過とともに、季節の変化、経済的な変動、新しいユーザー行動などの外部要因が、基となるデータの分布を変化させる可能性があります。data driftとして知られるこの現象は、モデルがエラーメッセージを出さずに予測を行うものの、その予測品質が許容基準を下回ってしまう「サイレント・フェイラー(静かなる失敗)」を引き起こす可能性があります。
効果的なモニタリングにより、これらの微細な変化を可視化できます。validation dataを用いてベースラインを確立し、本番環境のライブストリームと比較することで、エンジニアリングチームは異常を早期に検出できます。このプロアクティブなアプローチにより、タイムリーなmodel retrainingや更新が可能となり、autonomous vehiclesや不正検知アルゴリズムといったシステムを安全かつ効果的に維持できます。
Link to this sectionモデルモニタリングにおける主要メトリクス#
健全なMLシステムを維持するために、実務者は一般的に3つのカテゴリに分類される多様なメトリクスを追跡します。
- サービス信頼性メトリクス: これらはinference engineの運用上の健全性を追跡します。主要な指標には、inference latency(予測にかかる時間)や、GPUメモリ使用量などのシステムリソース利用率が含まれます。Prometheusのようなツールは、これらのシステムレベルのメトリクスを収集および保存するために一般的に使用されます。
- データ品質メトリクス: これらは、入力データが期待されるスキーマおよび統計的分布と一致していることを保証します。例えば、欠損値の急増や特徴量の平均値のシフトは、上流のデータパイプラインが破損していることを示している可能性があります。Kolmogorov-Smirnov testのような統計的テストは、トレーニング時の分布と本番環境の分布との間の距離を定量化するのに役立ちます。
- パフォーマンスメトリクス: 理想的には、チームはaccuracy、precision、recallといった正解ラベル(グラウンドトゥルース)に基づくメトリクスを監視します。しかし、本番環境では真のラベルが遅延したり利用できなかったりすることがよくあります。そのような場合、予測のconfidenceスコアや出力分布の安定性などのプロキシメトリクスを使用して、健全性を判断します。
Link to this section実社会での応用#
モデルモニタリングは、自動化された意思決定が運用や安全性に影響を与える様々な業界において不可欠です。
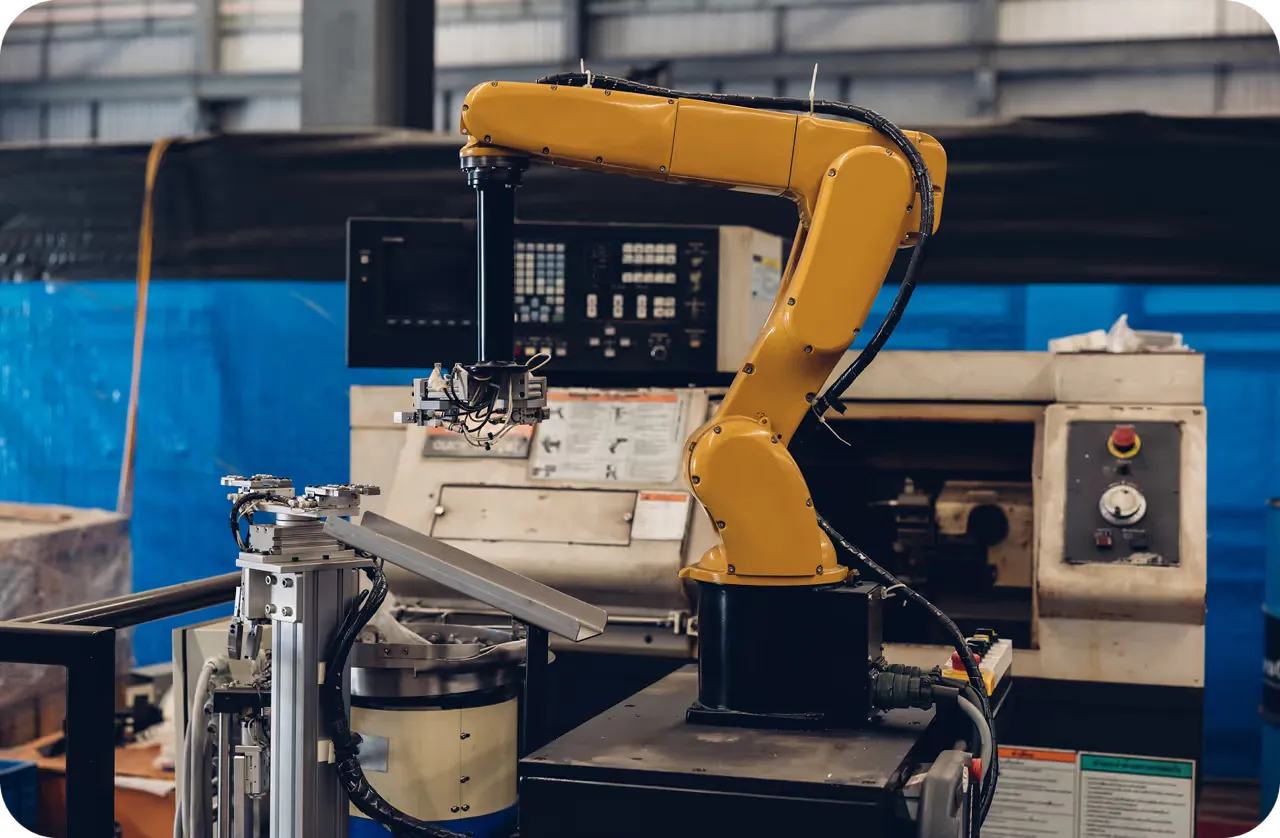
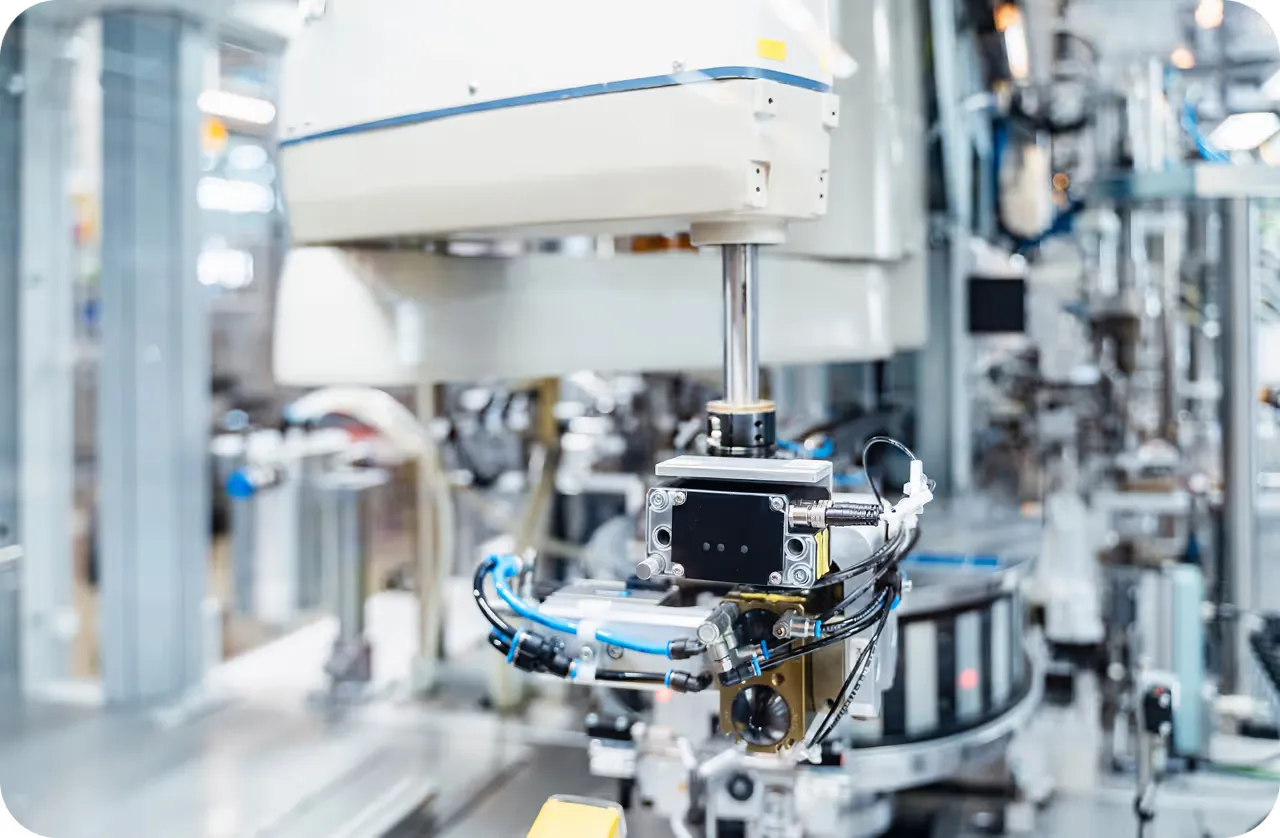
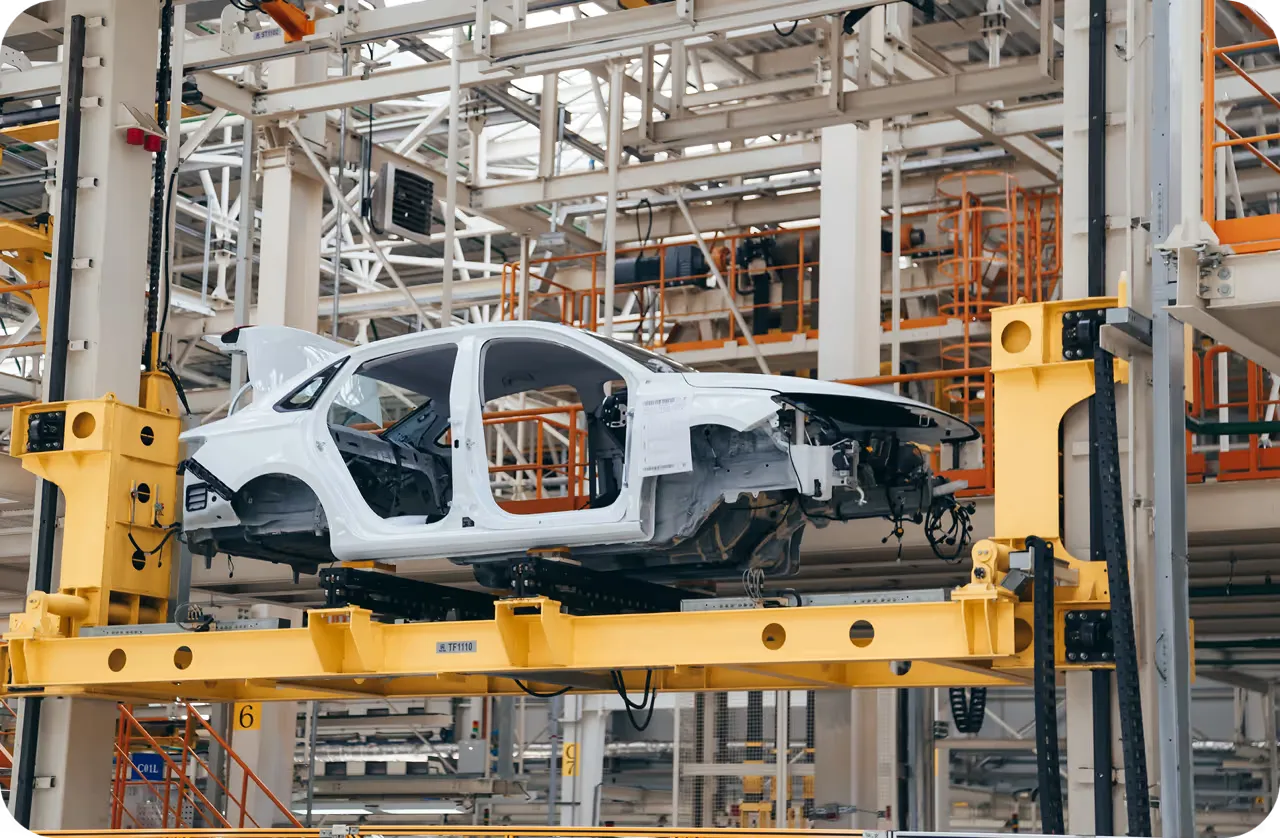
- 製造業におけるコンピュータビジョン: smart manufacturingにおいて、目視検査モデルは組立ライン上の欠陥を検出します。時間の経過とともに、カメラレンズに埃が蓄積したり、工場の照明が変化したりすることで、モデルが欠陥のない部品を欠陥品として誤分類する可能性があります。ポジティブ検知率を監視することは、このようなドリフトの特定に役立ち、Ultralytics Platformを使用したメンテナンスや再キャリブレーションを促進します。
- 金融不正検知: 銀行はMLを使用して不審な取引にフラグを立てます。犯罪者は検出を回避するために戦略を絶えず適応させており、コンセプトドリフトを引き起こします。フラグが立てられた取引の割合を監視し、人間のレビュー担当者からのフィードバックを調査することで、データサイエンティストは新しい不正パターンを認識するようにモデルを迅速に更新できます。
Link to this sectionモニタリングとオブザーバビリティの比較#
It is helpful to distinguish between monitoring and observability, as they serve complementary roles. Model Monitoring is typically reactive and focused on "known unknowns," using dashboards to alert teams when specific metrics breach a threshold (e.g., accuracy drops below 90%). Observability digs deeper into the "unknown unknowns," providing granular logs and traces that allow engineers to debug why a specific prediction failed or why a model exhibits bias in AI against a certain demographic.
Link to this section例:予測精度の追跡#
コンピュータビジョンモデルの健全性を監視する簡単な方法は、その予測の平均的な信頼度を追跡することです。信頼度が大幅に低下した場合、モデルがトレーニング時に想定していなかったデータに遭遇している可能性があることを示しています。
以下は、モニタリング目的で画像バッチから信頼度スコアを抽出するYOLO26を使用したPythonの例です:
import numpy as np
from ultralytics import YOLO

# Load the YOLO26 model
model = YOLO("yolo26n.pt")

# Run inference on a source (e.g., a video frame or image list)
results = model(["bus.jpg", "zidane.jpg"])

# Extract confidence scores for monitoring
for i, result in enumerate(results):
    # Get the confidence scores for all detected objects
    confidences = result.boxes.conf.cpu().numpy()

    if len(confidences) > 0:
        avg_conf = np.mean(confidences)
        print(f"Image {i}: Average Detection Confidence: {avg_conf:.3f}")
    else:
print(f"Image {i}: No objects detected.")これらの統計を定期的にログに記録することで、チームはGrafanaなどのツールやUltralytics Platform内のモニタリング機能を使用して経時的な傾向を可視化でき、動的な環境下でもモデルの堅牢性を維持できます。