Monitoring deployed computer vision models on Ultralytics Platform
Discover how to monitor computer vision models in production with Ultralytics Platform. Track metrics, detect issues, and improve reliability.
Testing computer vision models that analyze images and video isn’t always the same as running them in production. During development, such models or algorithms are tested on clean, well-prepared datasets where conditions are controlled and predictable.
Once deployed, things become more dynamic. Models are exposed to real-world traffic, where request volumes can vary, response times can change, and occasional failures can happen.
At this stage, the focus shifts to whether the system is running reliably, with endpoints that stay available, responsive, and stable under changing conditions.
That’s why monitoring is essential. It provides a clear view of how deployed endpoints behave in production through metrics such as request volume, latency, error rates, and overall system health.
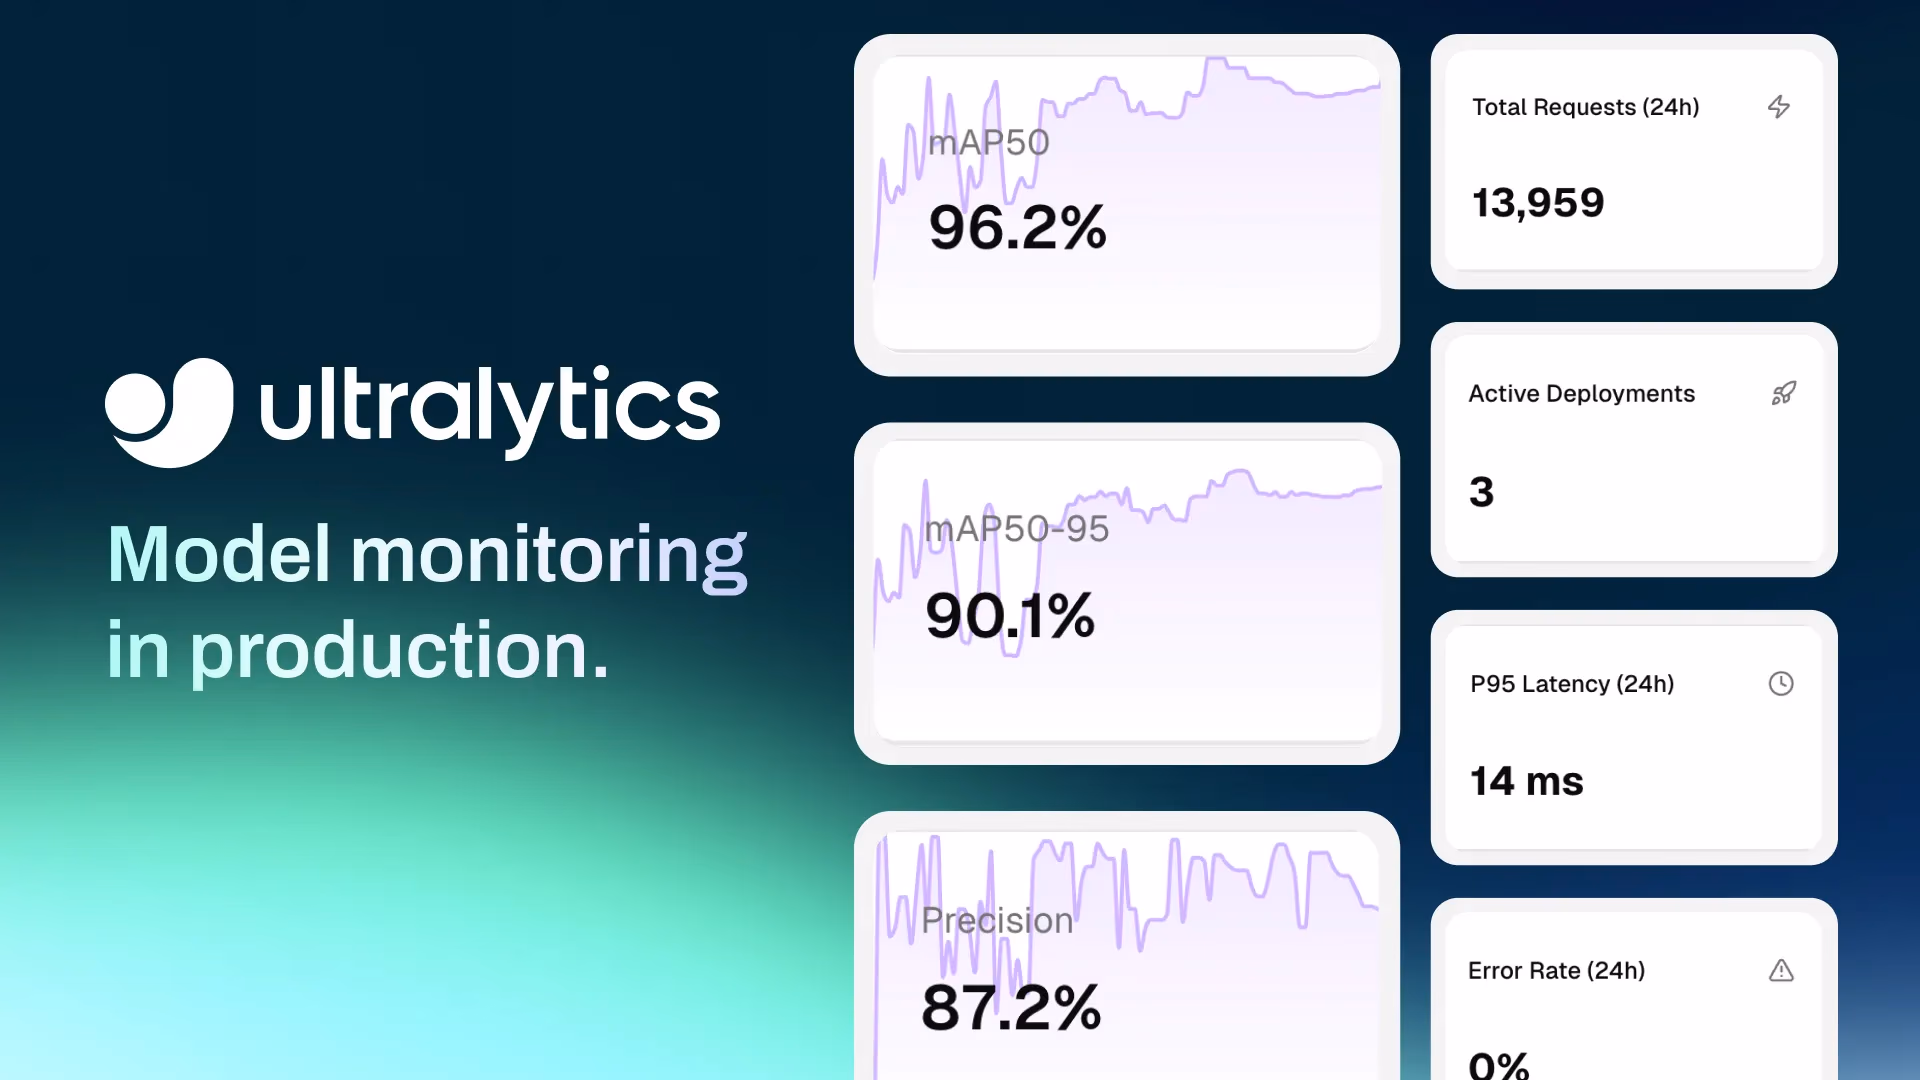
To make this easier, having the right tools in place becomes just as important as the model itself. Recently, Ultralytics introduced Ultralytics Platform, our new end-to-end environment that brings together the full computer vision workflow, from data and training to deployment and monitoring.
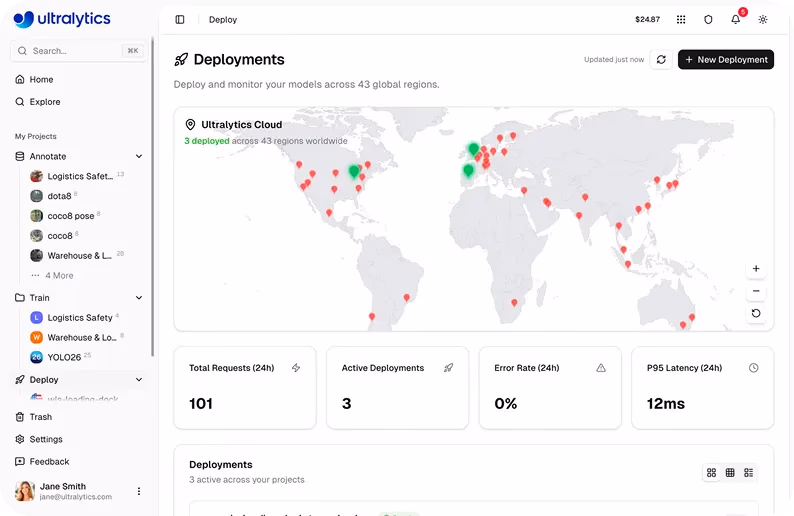
Fig 1. Ultralytics Platform’s deployment dashboard with monitoring features (Source)
With monitoring built directly into this workflow, users can track endpoint health, inspect request behavior, and maintain reliable systems without relying on separate tools. In this article, we’ll explore how to use Ultralytics Platform to monitor deployed model endpoints and keep production systems running smoothly. Let’s get started!
Link to this sectionAn overview of AI model monitoring#
In an AI model lifecycle, monitoring refers to observing how deployed systems behave once a model is live and serving real-world requests. While training and validation show how a machine learning model (ML model) performs on prepared datasets, monitoring focuses on how the deployed endpoint operates in a production environment.
A crucial part of monitoring is tracking system-level metrics that reflect reliability and responsiveness. Metrics such as latency and uptime help indicate how well the system is handling incoming requests. Latency measures how long it takes to process a request and return a response, while uptime highlights how consistently the endpoint remains available.
Another key aspect is observability, which provides visibility into how requests are handled. Each time an input, such as an image or video frame, is sent to a deployed model, it is processed as an inference request.
Logs capture these requests along with details like timestamps, response times, and status codes. These logs make it easier to trace requests, debug issues, and investigate failures when they occur. They are especially useful for identifying patterns such as repeated errors, slow responses, or unexpected system behavior.
By combining metrics and logs, monitoring helps users understand how their systems are operating in production and quickly respond to issues as they arise.
Link to this sectionA look at model performance metrics vs system metrics#
Before diving into production monitoring, let’s discuss the difference between model performance metrics and system metrics.
Typically, model monitoring is associated with evaluation metrics, also known as model metrics, such as accuracy, precision, recall, and mAP (mean average precision). These metrics are used to describe model behavior and assess the quality of model predictions, often in relation to production data or input data. They can be particularly useful for identifying edge cases or outliers in new data.
However, this is different from monitoring a deployed system in production. In this context, monitoring focuses on how the system is running rather than directly evaluating model predictions.
Instead of model metrics, deployment monitoring relies on system-level signals such as request volume, latency, error rates, and uptime. These metrics provide visibility into how endpoints handle input data, how consistently they respond, and how they operate in production environments.
Link to this sectionThe role of model monitoring in computer vision projects#
Next, let’s look at a real-world example that highlights the need for a monitoring system in computer vision deployments.
Consider a vision solution that uses pose estimation, a computer vision task that is used to identify and analyze human body movements, to monitor construction workers for safety compliance. During initial model deployment, such a system might perform well under controlled conditions with clear visibility and standard scenarios.
However, real construction sites introduce additional complexity. Request volumes can vary throughout the day, network conditions may be inconsistent, and multiple cameras or endpoints may be sending data at the same time. These factors can lead to slower responses or occasional failures if the system isn’t properly monitored.
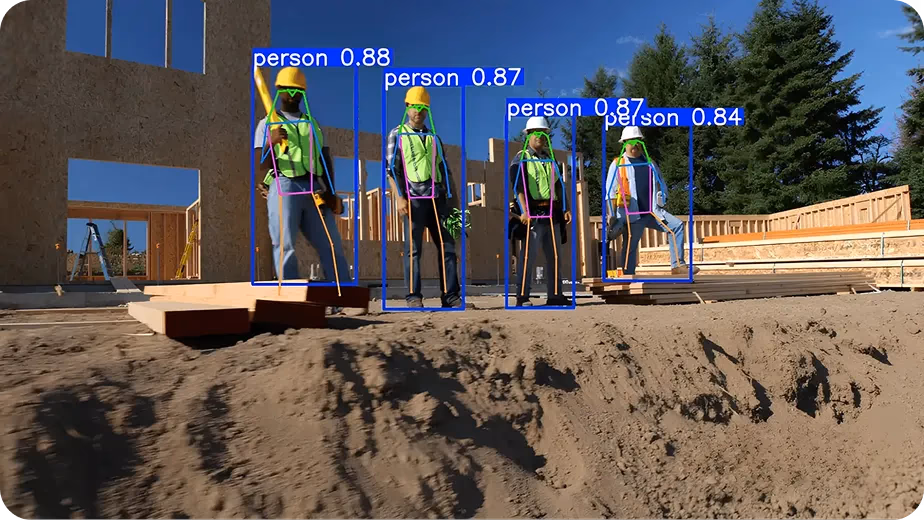
Fig 2. Pose estimation being used to monitor workers at a construction site (Source)
In a production environment like this, it becomes important to understand how reliably the system is operating. Monitoring provides visibility into whether endpoints are available, how quickly they respond to incoming requests, and how consistently they handle traffic over time.
For instance, an increase in latency may point to higher load or resource constraints, while a rise in error rates can indicate issues with request handling or system stability. Logs add more context by showing how individual requests are processed and where failures occur.
By tracking these signals, AI enthusiasts and data scientists can identify issues early, troubleshoot more effectively, and ensure that their systems continue to run reliably as real-world conditions change.
Link to this sectionUsing Ultralytics Platform to monitor deployed vision models#
In many deep learning workflows, monitoring is often handled using separate tools for logging, metrics, and system health. This fragmented setup can make it difficult to get a clear view of how deployed endpoints are operating in production and adds complexity to managing deployments.
Ultralytics Platform simplifies this by bringing monitoring directly into a unified environment that covers the full computer vision workflow, from data ingestion and annotation to training, deployment, and monitoring.
With this integrated setup, users can track how their deployed endpoints handle real-world traffic without setting up external logging systems or additional dashboards. Everything is available in one place, making it easier to observe system behavior and maintain reliable deployments over time.
Monitoring features can be accessed directly from the Deploy tab. From a single dashboard, users can track key metrics, analyze request-level behavior, and visualize trends. These built-in visualizations make it easier to understand how solutions are performing without switching between tools.
By bringing monitoring, deployment, and model management together within the broader workflow, the platform reduces complexity. This makes it more seamless to focus on managing deployments, optimizing system performance, and maintaining reliability.
Link to this sectionBuilt-in monitoring features of Ultralytics Platform#
In real-world deployments, monitoring depends on having clear visibility into how systems are running as conditions change over time. It goes beyond tracking a few metrics and involves understanding how deployed endpoints behave across environments and managing multiple deployments effectively.
Inspired by feedback from the vision AI community on common computer vision challenges, the Ultralytics Platform includes several capabilities that make monitoring more practical and scalable.
Here’s an overview of some of these key features:
- Global deployment visibility: The Deploy page includes an interactive world map that displays deployment regions with visual indicators for active and in-progress endpoints, allowing users to monitor geographic distribution and regional activity.
- Flexible dashboard views: The deployments dashboard provides multiple view modes, including card view, compact grid, and table view with sortable columns such as name, region, status, and requests, supporting structured monitoring and comparison.
- Monitoring multiple endpoints: The dashboard aggregates monitoring data across all deployments using overview cards and deployment lists.
- Data retention policies: Monitoring data is retained for a defined period, with metrics available for 30 days and logs for 7 days, supporting recent performance analysis and debugging workflows.
- External monitoring support: Deployment endpoints can be monitored using external tools such as Datadog, New Relic, and uptime monitoring services, or accessed via API endpoints for custom monitoring and health checks.
Next, we’ll walk through some of these features in more detail and see how they can be used to monitor deployed endpoints in production.
Link to this sectionHow to track key performance metrics using Ultralytics Platform#
Once a model is deployed, monitoring starts with tracking key system metrics. While metrics such as accuracy and recall are useful during development, production monitoring focuses on system-level signals like response time and error rates, which provide measurable insights into how reliably endpoints are handling real-world traffic.
Ultralytics Platform provides a centralized dashboard that offers a clear view of endpoint activity and system behavior. In particular, the Deployment dashboard includes four key metrics that show how endpoints are being used and how they respond to incoming requests.
Here’s a closer look at these metrics:
- Total requests: The total number of requests made across all endpoints over a 24-hour period. This helps identify usage patterns and overall demand.
- Active deployments: The number of endpoints currently running and serving requests.
- P95 latency: The response time within which 95% of requests are completed. This gives a more realistic view of performance by accounting for slower responses.
- Error rate: It is the percentage of failed requests out of the total number of requests. This metric helps identify issues and can be used to detect anomalies.
Simply put, these metrics provide a clear view of how deployed endpoints operate in production. By analyzing usage patterns, teams and individuals can understand traffic distribution, identify peak load periods, and ensure that systems remain responsive and reliable as usage grows.
Link to this sectionUnderstanding model deployment behavior through logs#
While metrics provide a high-level view of system performance, logs offer a more detailed look at how deployed endpoints handle individual requests. Logs record each request sent to an endpoint along with the corresponding response.
They are useful for tracking issues, inspecting failures, and understanding how requests are processed. Within the Ultralytics Platform, you can select any deployment to view its details, including logs.
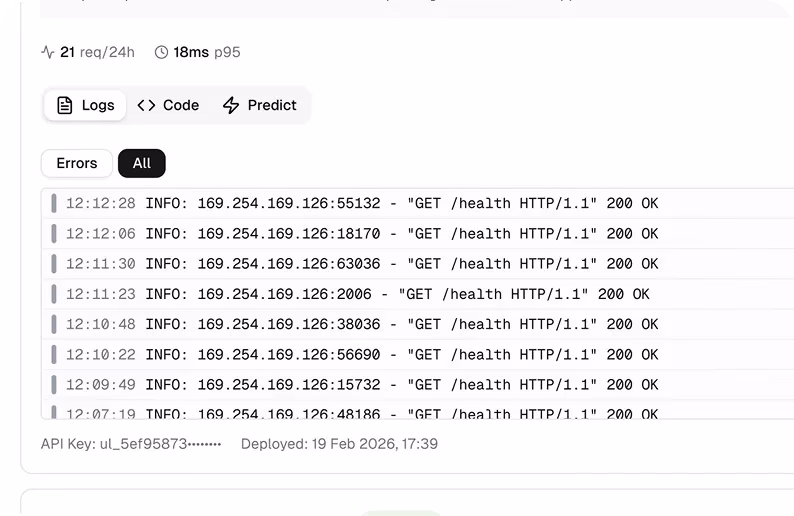
Fig 3. An example of logs within Ultralytics Platform (Source)
A log entry in the platform is displayed in a structured format, making it easier to understand what happened during each request. Each entry includes a severity level, which indicates how important the event is, along with a timestamp showing when it occurred.
It also contains a message describing the event and HTTP-related details such as status codes and latency. This information helps trace requests, support troubleshooting, and debug issues more effectively. On top of this, logs are grouped by severity, so users can prioritize deployments that need attention.
Link to this sectionAnalyzing endpoint health and reliability on Ultralytics Platform#
Monitoring also involves understanding the overall health of deployed endpoints, including whether they are running properly, responding on time, and consistently handling requests without errors. The Ultralytics Platform provides a clear view of each deployment’s health status, making it straightforward to verify that endpoints are operating as expected.
The platform includes visual health indicators for each deployment, displayed on individual deployment cards.
For example, a green indicator shows that the endpoint is healthy and responding normally, while a red indicator signals issues or downtime. A spinning icon indicates that the system is actively checking the deployment’s status.
By tracking endpoint health over time, it becomes possible to detect issues early, maintain consistent performance, and ensure a stable experience for applications running in production.
Link to this sectionThe connection between monitoring data and performance improvement#
Model monitoring isn't just about tracking metrics. It creates a feedback loop that supports continuous improvement over time. As endpoints handle real-world traffic, patterns begin to emerge in metrics and logs that can reveal issues such as increased latency, higher error rates, or inconsistent system behavior.
Monitoring highlights areas that need attention. For example, consistently high latency may indicate the need for better resource allocation or scaling, while a rising error rate can point to issues with request handling or system stability.
Once these issues are identified, steps can be taken to improve reliability. This may involve adjusting infrastructure, scaling resources, or fixing issues in how requests are processed. After these changes, systems can continue to be monitored to confirm that performance has improved.
By linking monitoring with ongoing improvements, users can maintain robust systems as usage grows and conditions change.
Link to this sectionExploring a real-world example: Monitoring luggage handling in aviation#
To get a better understanding of the impact of monitoring in a real-world scenario, let’s explore how it applies to the automation of aviation ground operations.
Take a vision system designed to monitor luggage loading and unloading during aircraft ground operations. In this setup, an object detection model like Ultralytics YOLO26 can be used to detect whether baggage falls off conveyor belts or handling equipment.
During testing and early deployment, the real-time system may perform well, accurately identifying luggage and responding quickly.
In a live airport environment, though, conditions are far less predictable. Lighting changes throughout the day, multiple cameras stream data at the same time, and request volumes spike during busy periods. These factors can cause latency to rise or errors to appear, and without visibility into the system, such issues can easily go unnoticed.
This is where monitoring becomes valuable. By tracking metrics like request volume, latency, and error rates alongside detailed logs, teams can quickly see when an endpoint is slowing down or failing. If latency climbs during peak hours, it may signal the need to scale resources, while a sudden rise in errors can point to problems with specific cameras or request handling. Acting on these signals helps keep the system reliable, so baggage handling can continue to be monitored accurately even as conditions change.
Link to this sectionKey takeaways#
Monitoring is what keeps deployed computer vision models reliable once they leave the controlled conditions of development and start handling real-world traffic. By focusing on system-level signals like request volume, latency, error rates, and uptime, alongside detailed logs, monitoring provides the visibility needed to detect issues early and keep production systems running smoothly.
With monitoring built directly into the deployment workflow, Ultralytics Platform makes it easier to track endpoint health, inspect request behavior, and maintain reliable systems without relying on separate tools. By bringing data, training, deployment, and monitoring together in one place, the platform helps teams move from experimentation to dependable real-world deployments.
Join our growing community and explore our GitHub repository to learn more about vision AI. To build with vision AI today, check out our licensing options. Discover how AI in manufacturing and AI in healthcare are shaping the future by visiting our solutions pages.


