False Positive Rate
False positive rate (FPR) is the share of actual negatives wrongly labeled positive, with its formula, related metrics, and threshold effects explained.
False positive rate (FPR) is the proportion of actual negative examples that a model incorrectly classifies as positive. It measures false alarms among cases where the target condition is absent. In machine learning, it helps evaluate classification systems when unnecessary alerts carry operational costs.
How to Calculate False Positive Rate#
FPR uses two counts from a confusion matrix: false positives (FP), negatives incorrectly labeled positive, and true negatives (TN), negatives correctly labeled negative. The ground-truth labels establish which examples are actually negative.
FPR = FP / (FP + TN)
The denominator includes every actual negative. FPR ranges from 0 to 1; multiplying by 100 gives a percentage. With 20 false positives and 980 true negatives, FPR is 20 / 1,000 = 2%. With no actual negatives, FPR is undefined.
Install scikit-learn to calculate FPR using its bundled handwritten-digit images. This logistic regression classifier recognizes the digit 9; scikit-learn's confusion matrix supplies the error counts.
from sklearn.datasets import load_digits
from sklearn.linear_model import LogisticRegression
from sklearn.metrics import confusion_matrix
from sklearn.model_selection import train_test_split

images, digits = load_digits(return_X_y=True)
# Treat 9 as positive and every other digit as negative.
labels = (digits == 9).astype(int)
X_train, X_test, y_train, y_test = train_test_split(images, labels, test_size=0.3, random_state=42, stratify=labels)
model = LogisticRegression(max_iter=1000)
model.fit(X_train, y_train)
predictions = model.predict(X_test)

tn, fp, fn, tp = confusion_matrix(y_test, predictions, labels=[0, 1]).ravel()
fpr = fp / (fp + tn)
print(f"False positive rate: {fpr:.2%}")
The percentage measures how often held-out images of other digits are incorrectly recognized as 9.
FPR vs. Specificity, Precision, and Recall#
Specificity is the true negative rate, TN / (TN + FP), so FPR = 1 − specificity. A specificity of 98% corresponds to an FPR of 2%. True positives (TP) are correctly identified positives; false negatives (FN) are actual positives labeled negative.
The related metrics use different denominators:
- Precision: TP / (TP + FP) measures correctness among positive predictions. Its complement, FP / (TP + FP), is the false discovery proportion.
- Recall: TP / (TP + FN), also called sensitivity or true positive rate, measures how many actual positives are found. False negative rate is 1 − recall.
- Accuracy: (TP + TN) / all examples measures overall correctness. FPR isolates mistakes within the negative class.
FPR's statistical foundation is Type I error: rejecting a true null hypothesis. Jerzy Neyman and Egon Pearson formalized controlling this error while maximizing detection power in their 1933 hypothesis-testing framework.
Thresholds and False Alarm Costs#
A confidence threshold turns scores into decisions. For fixed scores, raising it can only maintain or reduce FPR, while recall can also decrease. A receiver operating characteristic (ROC) curve plots recall against FPR across thresholds; area under the curve summarizes that ranking behavior.
FPR multiplied by negative-case volume gives the expected false-alarm count. Threshold selection uses validation data, with final reporting on separate test data. Hard negative mining focuses training on confusing negatives. Ultralytics YOLO26 models expose conf in Predict mode, filtering detections below a chosen score threshold and changing which false alarms reach an application.
In healthcare, false-positive screening results can cause anxiety and additional invasive procedures.
FPR in Computer Vision#
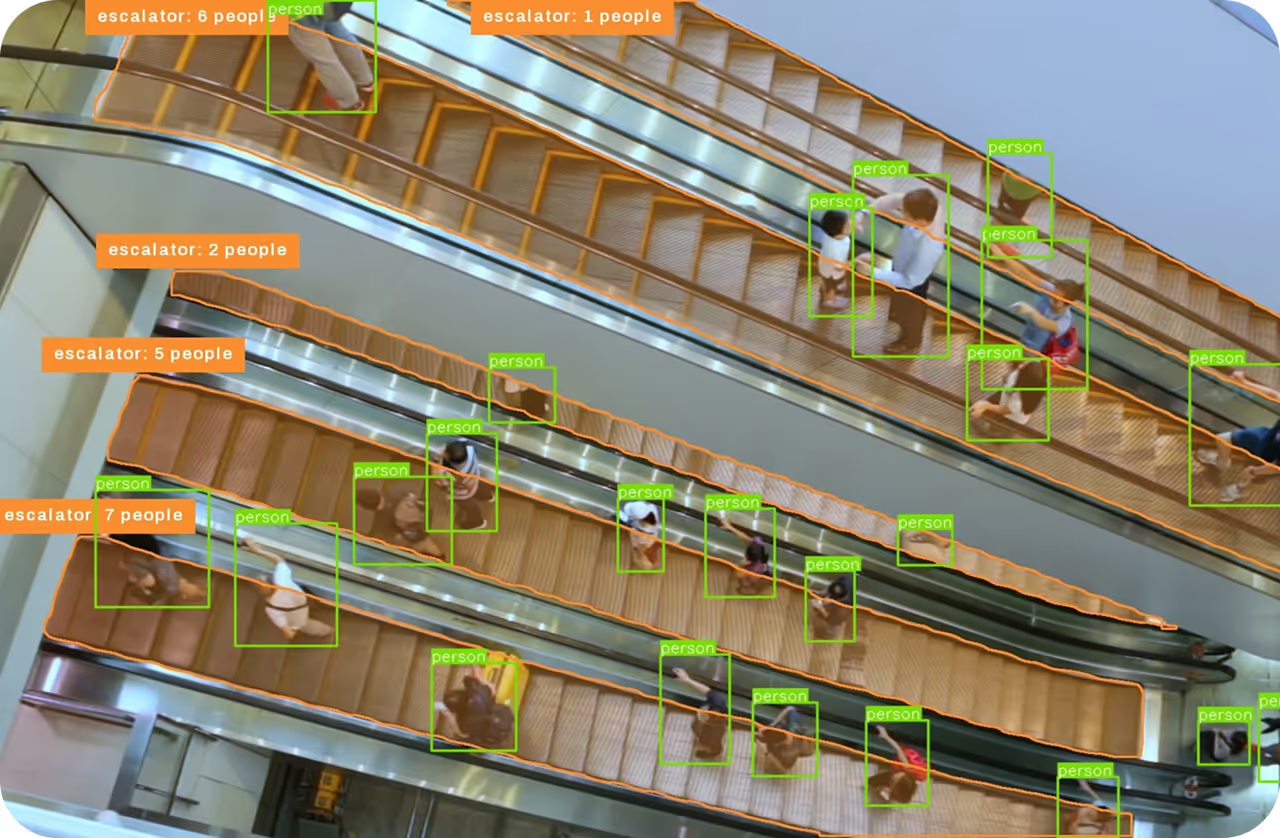
In object detection, unmatched bounding boxes count as false positives; duplicate boxes can also count despite matching a labeled object's class and intersection over union requirements. Background regions have no standard true-negative count, so detection commonly uses false positives per image or a precision-recall curve. For image-level FPR, define a positive as at least one target-class detection: each target-absent image with such a detection contributes one FP, regardless of box count.
In security, facial recognition can produce erroneous identity matches. NIST's one-to-many evaluation defines false positive identification rate as the proportion of searches by people absent from the gallery that return at least one candidate above the match threshold.