Scene Graph
Scene graph is a visual representation of objects, attributes, and relationships that supports reasoning, image search, and robotics.
A scene graph is a structured representation of a visual scene in which nodes represent objects, attributes describe their properties, and labeled edges describe relationships between them. It turns an image into connected facts: which objects appear, what they are like, and how they interact. In computer vision, this structure supports reasoning about a scene beyond recognizing individual objects.
Justin Johnson, Ranjay Krishna, and colleagues introduced the modern image-grounded formulation in their 2015 work on image retrieval using scene graphs. Their representation included objects such as a man and a boat, the boat's white color, and the relationship "man standing on boat," enabling searches that specify relationships as well as object categories.
Objects, Attributes, and Relationships#
Each node identifies an object instance. Two horses in one image receive separate identities even though their category labels match. A bounding box locates each instance, providing grounding: a connection between a symbolic object and its image region. Attributes attach properties such as color or material to that instance. Relationships connect two instances through a predicate, the label describing their connection. The resulting subject–predicate–object triple expresses one relational fact.
The Visual Genome dataset, developed by Ranjay Krishna and collaborators, contains 108,077 images with structured visual annotations. Scene graphs are image-specific forms of a knowledge graph. Their semantic relationships permit multiple connections between objects and disconnected components, so an image scene graph has no required root node.
The Visual Genome Python driver's scene graph example includes "horse is wearing bridle" and "window is next to door." These annotations can be represented with a directed graph using NetworkX, installed with pip install networkx:
import networkx as nx

graph = nx.MultiDiGraph()
graph.add_node("horse", label="horse")
graph.add_node("bridle", label="bridle")
graph.add_node("window", label="window")
graph.add_node("door", label="door")

graph.add_edge("horse", "bridle", predicate="is wearing")
graph.add_edge("window", "door", predicate="is next to")

for subject, obj, relation in graph.edges(data=True):
    print(f"{subject} -> {relation['predicate']} -> {obj}")
The output exposes two queryable relational facts, with each predicate attached to its directed edge.
How Scene Graph Generation Works#
Scene graph generation, abbreviated SGG, predicts this representation from visual input. A typical pipeline combines object detection, feature extraction, and relationship classification. Object features describe individual regions; pairwise features describe candidate interactions. Context models such as MotifNet use surrounding objects to help predict relationships. Graph neural networks can also exchange information across connected objects, producing embeddings that encode relational context.
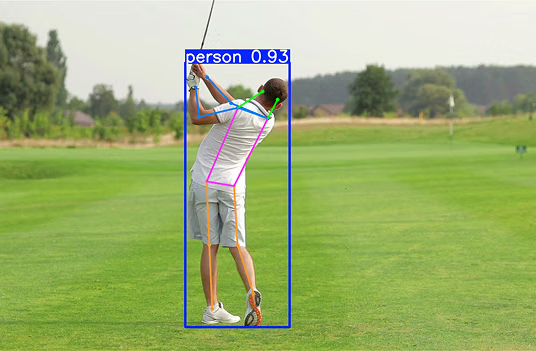
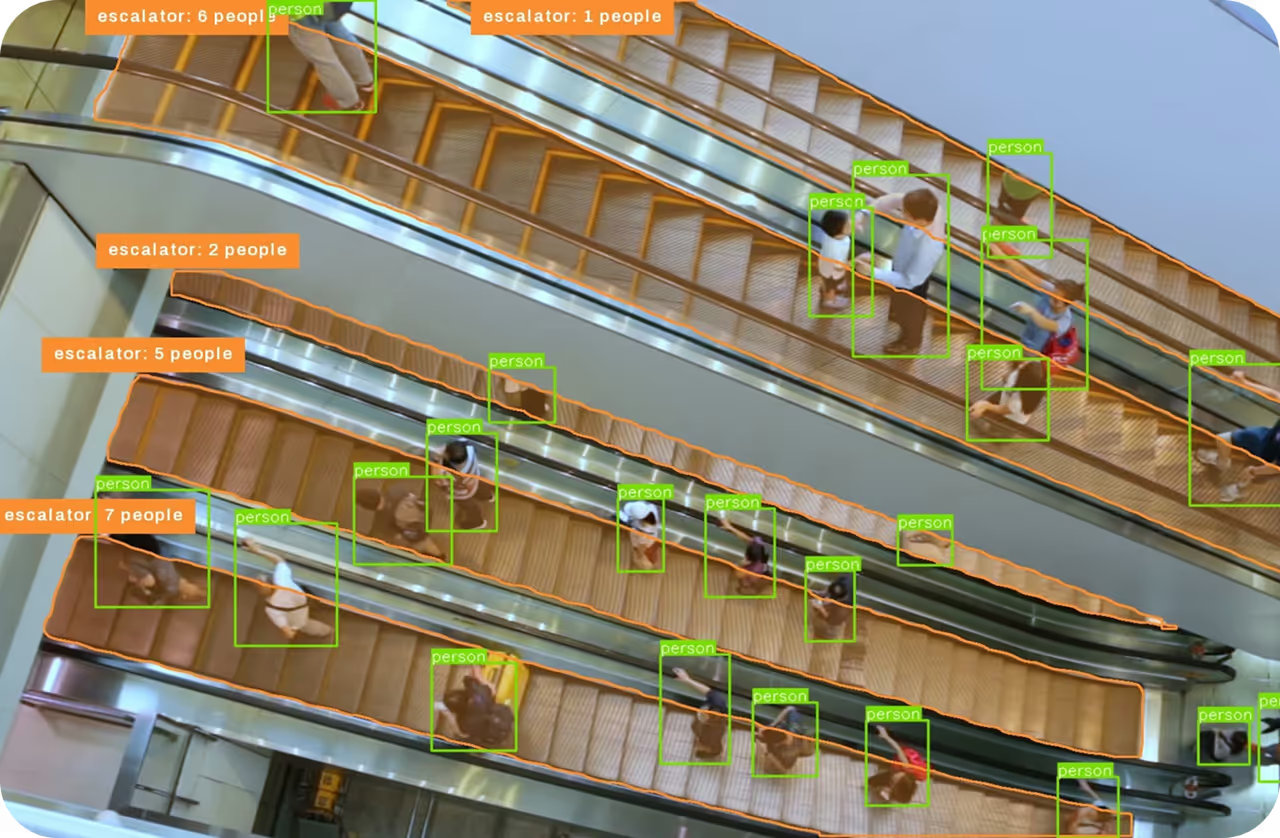
Ultralytics YOLO YOLO26 supplies the object instances for this pipeline through its detection outputs: boxes, class labels, and confidence scores. A downstream relationship model uses those instances to predict edges such as "wearing" or "standing on."
Applications in Visual Reasoning and Robotics#
Explicit relationships support tasks that require understanding how objects fit together:
- Visual question answering: GQA uses scene graphs derived from Visual Genome to generate questions and functional reasoning programs. Traversing object relationships supports visual reasoning, including identifying objects through their attributes and connections.
- Robotics: Kimera builds 3D dynamic scene graphs from visual-inertial input. Its layered representation connects objects, people, rooms, and buildings, supporting semantic mapping and hierarchical path planning. Spatial coordinates and time extend the representation beyond a single image.
- Image generation: Justin Johnson, Agrim Gupta, and Li Fei-Fei's image generation from scene graphs system converts graphs into object layouts, predicts boxes and segmentation masks, and generates an image from that layout. The graph specifies both scene contents and relationships.
Evaluation and Relationship Errors#
Scene graph evaluation commonly separates three tasks. Predicate classification provides object boxes and labels and evaluates predicted relationships. Scene graph classification provides boxes and requires object and relationship labels. Scene graph detection requires the complete graph from the image. This separation identifies whether errors originate in localization, object recognition, or relationship prediction.
Relationship frequencies create dataset bias: frequent predicates dominate predictions while rare, informative relationships are missed. Recall@K measures the fraction of annotated relationships recovered among the K highest-ranked predictions. Mean Recall@K computes recall separately for each predicate category and averages those values, giving rare predicates the same category-level weight as frequent ones.