Causal Discovery
Learn how causal discovery uncovers cause-and-effect relationships, DAGs, and AI applications using vision data, Ultralytics YOLO, and practical guidance.
Causal discovery is the process of learning possible cause-and-effect relationships from data, usually represented as a directed graph. Unlike ordinary machine learning, which primarily predicts outcomes from patterns, causal discovery asks which variables may directly influence others. For example, it might investigate whether rain increases traffic congestion, whether congestion changes signal timing, or whether both are influenced by a third factor.
The result is a hypothesis about causal structure, not automatic proof. Its reliability depends on data quality, domain knowledge, statistical assumptions, and validation through experiments or new environments.
How Causal Discovery Works#
A causal discovery system treats measured variables as nodes and their possible causal relationships as edges. In a directed edge such as X → Y, X is a candidate direct cause of Y relative to the other variables included in the analysis. These relationships are often represented by a Bayesian network or directed acyclic graph (DAG), meaning the arrows cannot form a directed loop.
Algorithms generally learn structure in one of three ways:
- Constraint-based discovery tests whether variables become statistically independent after conditioning on other variables. The PyWhy constraint-based discovery documentation explains how these independence patterns can restrict possible graph structures.
- Score-based discovery compares candidate graphs using a score that balances fit against complexity.
- Functional-model discovery assumes variables are generated through particular mathematical relationships and noise patterns. In a linear non-Gaussian acyclic setting, asymmetry in the data may help determine edge direction.
The causal-learn documentation provides implementations spanning these categories. However, observational data often supports several equivalent graphs rather than one uniquely oriented DAG.
Key Concepts and Related Terms#
Causal discovery must be distinguished from several related ideas:
- Correlation measures statistical association. Two variables can move together because one causes the other, causality runs in reverse, or a third variable affects both. Google’s guidance on correlation and causation highlights why predictive association alone is insufficient.
- Causal inference estimates the effect of a defined intervention, such as changing a machine setting. Discovery proposes the graph; inference uses an assumed graph to answer a specific effect question. The DoWhy causal modeling guide shows how graphs make these assumptions explicit.
- Causal representation learning seeks meaningful latent variables from complex inputs such as images. Causal discovery typically studies relationships among variables that have already been defined.
- Explainable AI describes why a model produced a prediction. Feature importance can explain a prediction without showing that changing the feature would change the real-world outcome.
Important graph concepts include confounders, which influence both a proposed cause and outcome; mediators, which transmit an effect; and colliders, which are influenced by two other variables. The UCLA introduction to causal DAGs explains why conditioning on the wrong variable can introduce rather than remove bias.
Real-World AI and Computer Vision Applications#
-
Manufacturing inspection: A computer vision system may record defect counts, conveyor speed, material type, temperature, and maintenance events. Causal discovery can suggest whether higher speed contributes directly to defects or whether both are consequences of increased production demand. This distinction matters before slowing the line or changing maintenance schedules.
-
Traffic management: Object detection and object tracking can produce vehicle counts, queue lengths, and movement trajectories. Combined with weather, incidents, and signal settings, causal discovery may help distinguish whether signal timing creates long queues or is adjusted in response to existing congestion. Such directionality is essential when selecting a policy intervention.
These graphs can guide later what-if analysis, including simulations described in the DoWhy intervention documentation.
Building Variables from Vision Data#
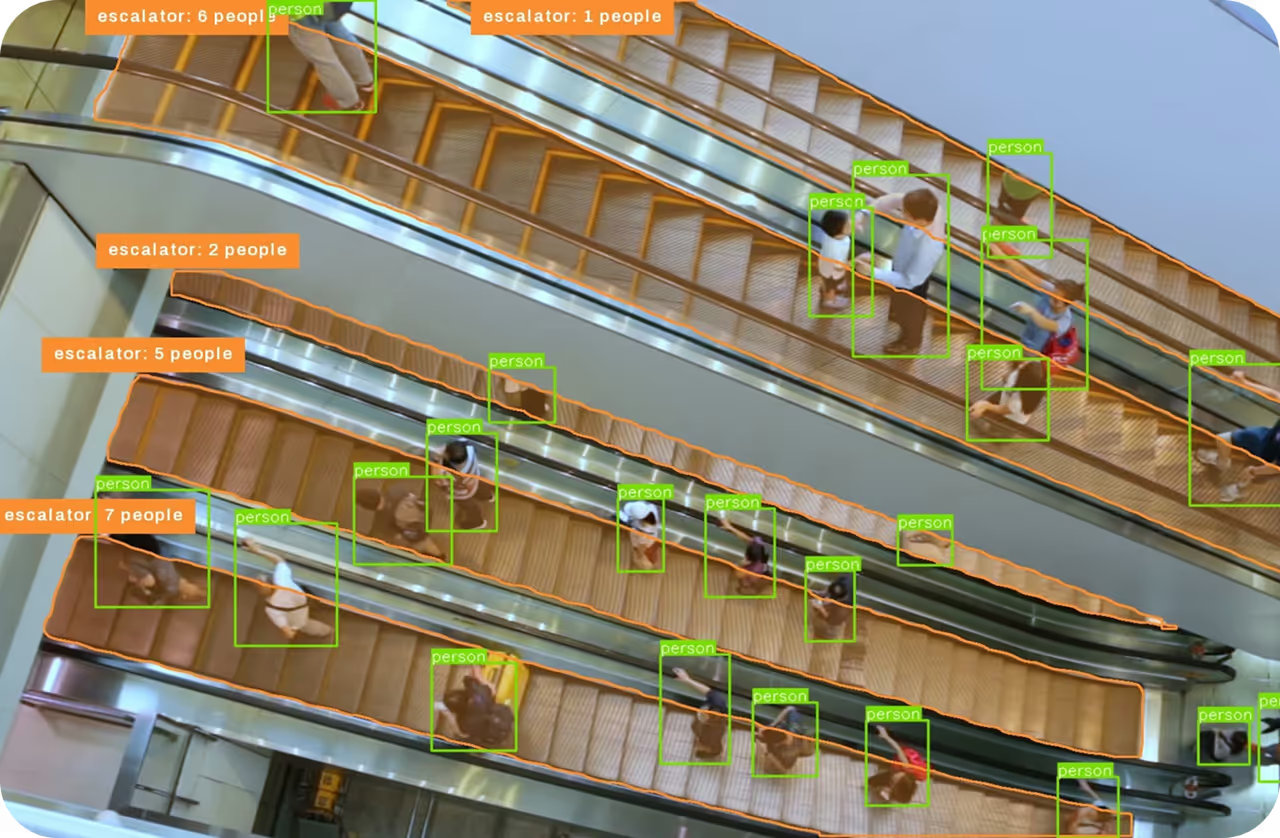
Ultralytics YOLO outputs can provide observed variables for a larger causal dataset. This example uses YOLO26 and Predict mode to extract counts from an image:
from ultralytics import YOLO

# Run object detection
model = YOLO("yolo26n.pt")
results = model("https://ultralytics.com/images/bus.jpg")

# Convert detections into measurable variables
result = results[0]
detected_objects = [result.names[int(class_id)] for class_id in result.boxes.cls]

person_count = detected_objects.count("person")
total_objects = len(detected_objects)

print({"person_count": person_count, "total_objects": total_objects})
Running this workflow across many timestamps, cameras, or operating conditions creates observations that can be joined with contextual variables. High-quality data annotation and consistent measurement are critical because detection errors can create false dependencies. Ultralytics Platform can support cloud dataset annotation, model training, deployment, and monitoring within this broader pipeline.
Limitations and Practical Guidance#
Causal discovery cannot reliably recover variables that were never measured. Hidden confounders, dataset bias, selection effects, small samples, and measurement errors can all produce misleading edges.
Before acting on a discovered graph:
- Add known temporal and physical constraints.
- Test whether edges remain stable across sites, time periods, and data subsets.
- Compare the graph with expert knowledge.
- Quantify uncertainty instead of treating every edge as certain.
- Validate important relationships through controlled interventions when feasible.
Finally, use causal effect estimation—not graph discovery alone—to measure intervention size. The EconML treatment-effect documentation illustrates this separate estimation stage. Causal discovery is most valuable as a structured way to generate, challenge, and refine causal hypotheses before making real-world decisions.